

The Ddosify Platform has a convenient feature that lets you import your Postman Collection, enabling a swift way to test your API endpoints without the additional effort of setting up endpoints on both platforms. This feature also supports the import of Postman Environments as Environment Variables within Ddosify.
Table of Contents
What is Ddosify?
Ddosify is an open-source Kubernetes Monitoring and Performance Testing platform. If you want to learn more about Ddosify, you can check out the Ddosify Documentation.
How to make Postman Import in Ddosify?
We will use the Ddosify test API as a postman collection. It has all the endpoints that we need.
For example;
GET /currencies/endpoint send request to https://testserverk8s.ddosify.com our test server returns HTTP 200.GET /exchange_rate/{base}/{to}/to get the exchange rate, endpoint then sends HTTP 200 OK along with a currency rate. etc.
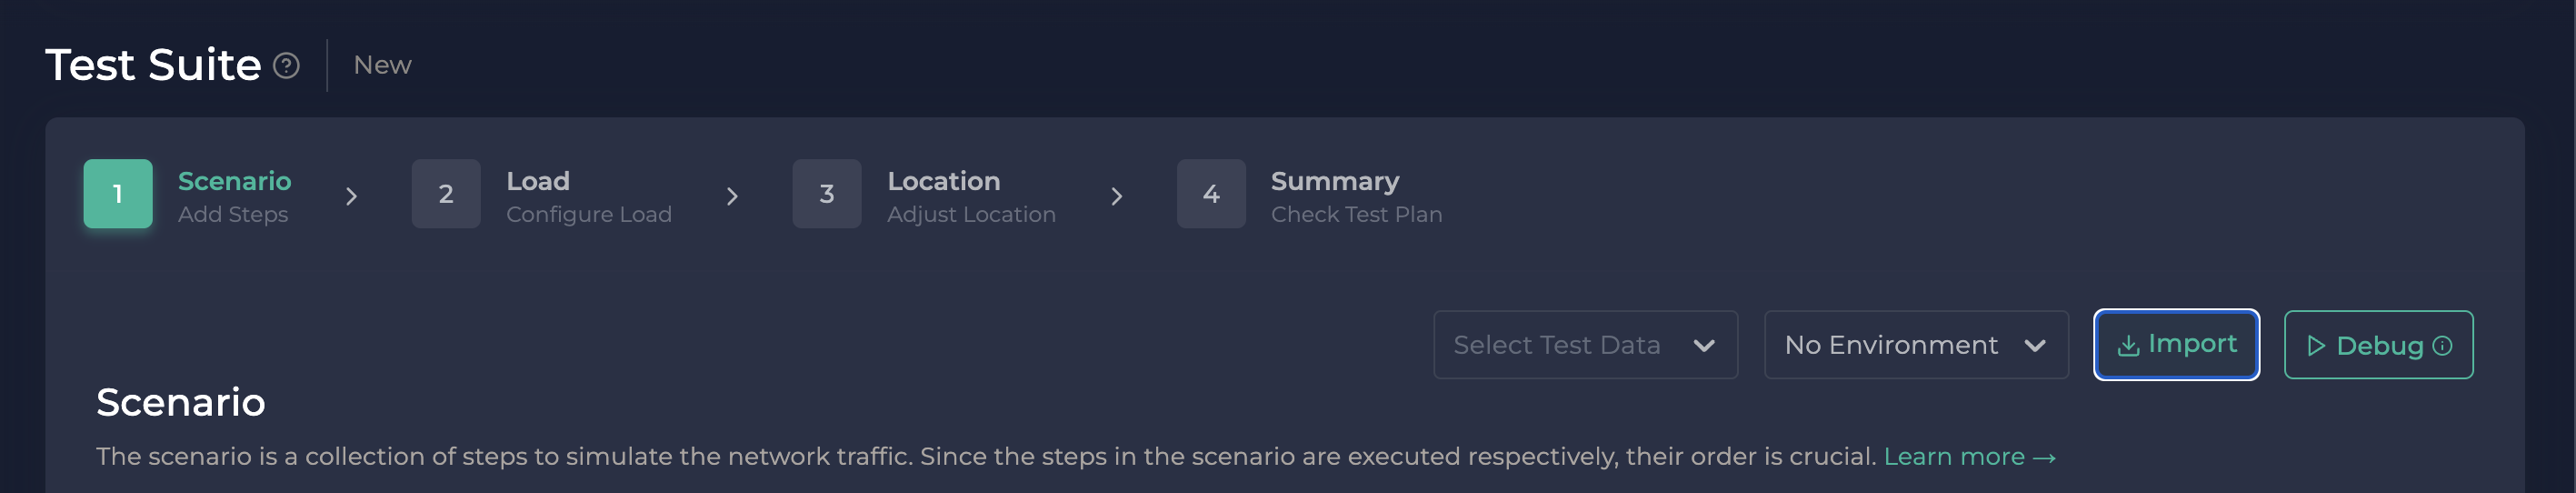
To import Postman to Ddosify, just follow these simple steps:
- Click the 'Import' button, which can be found at the top-right corner of the Scenario Step.
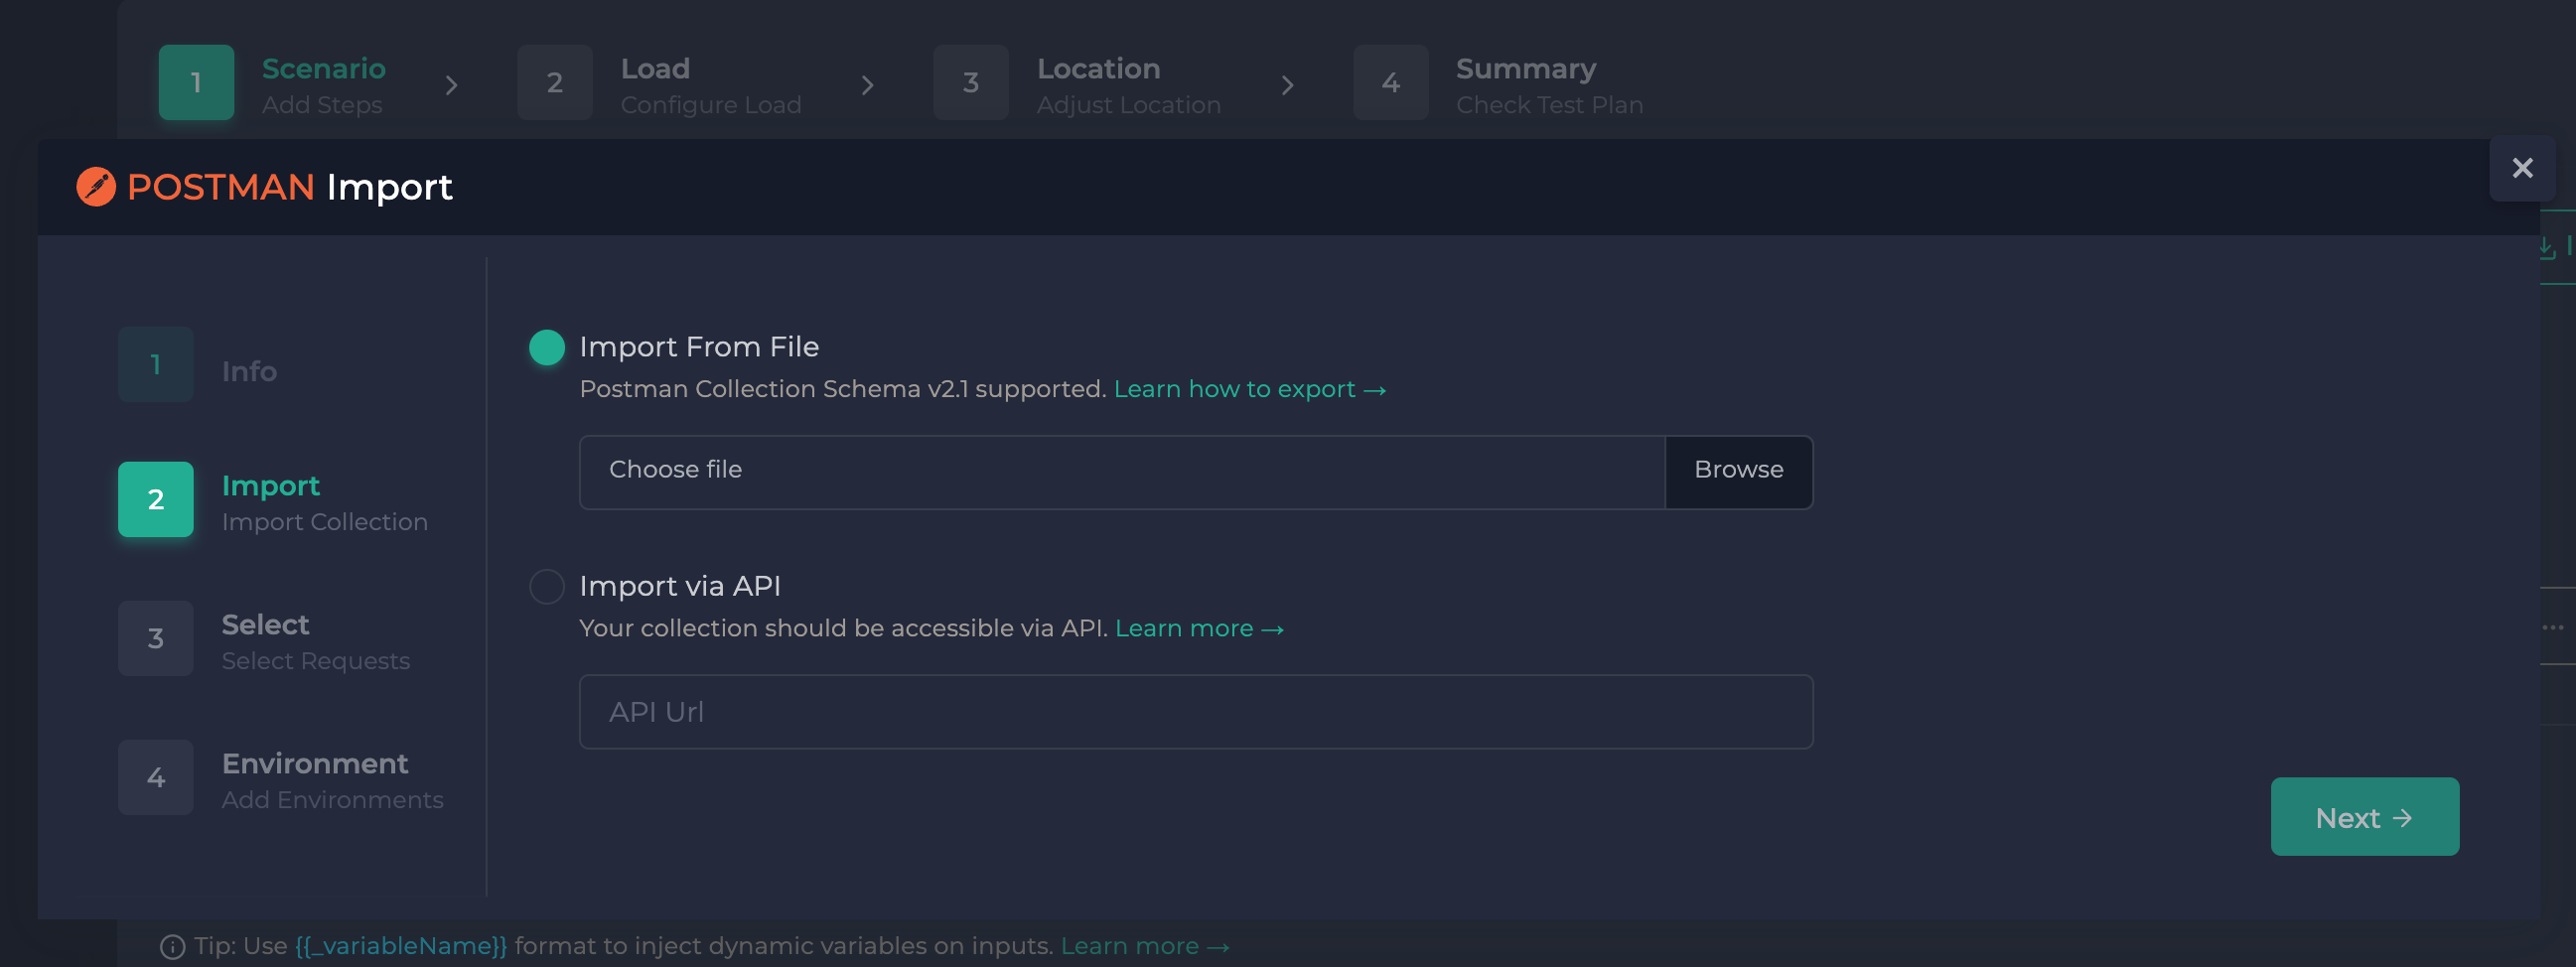
- Next, you can import your collection into the Ddosify App in two ways: you can either use an API that has been exported from Postman, or you can upload a collection file. For more details about exporting your Postman Collections, you can check out the Postman Export documentation.
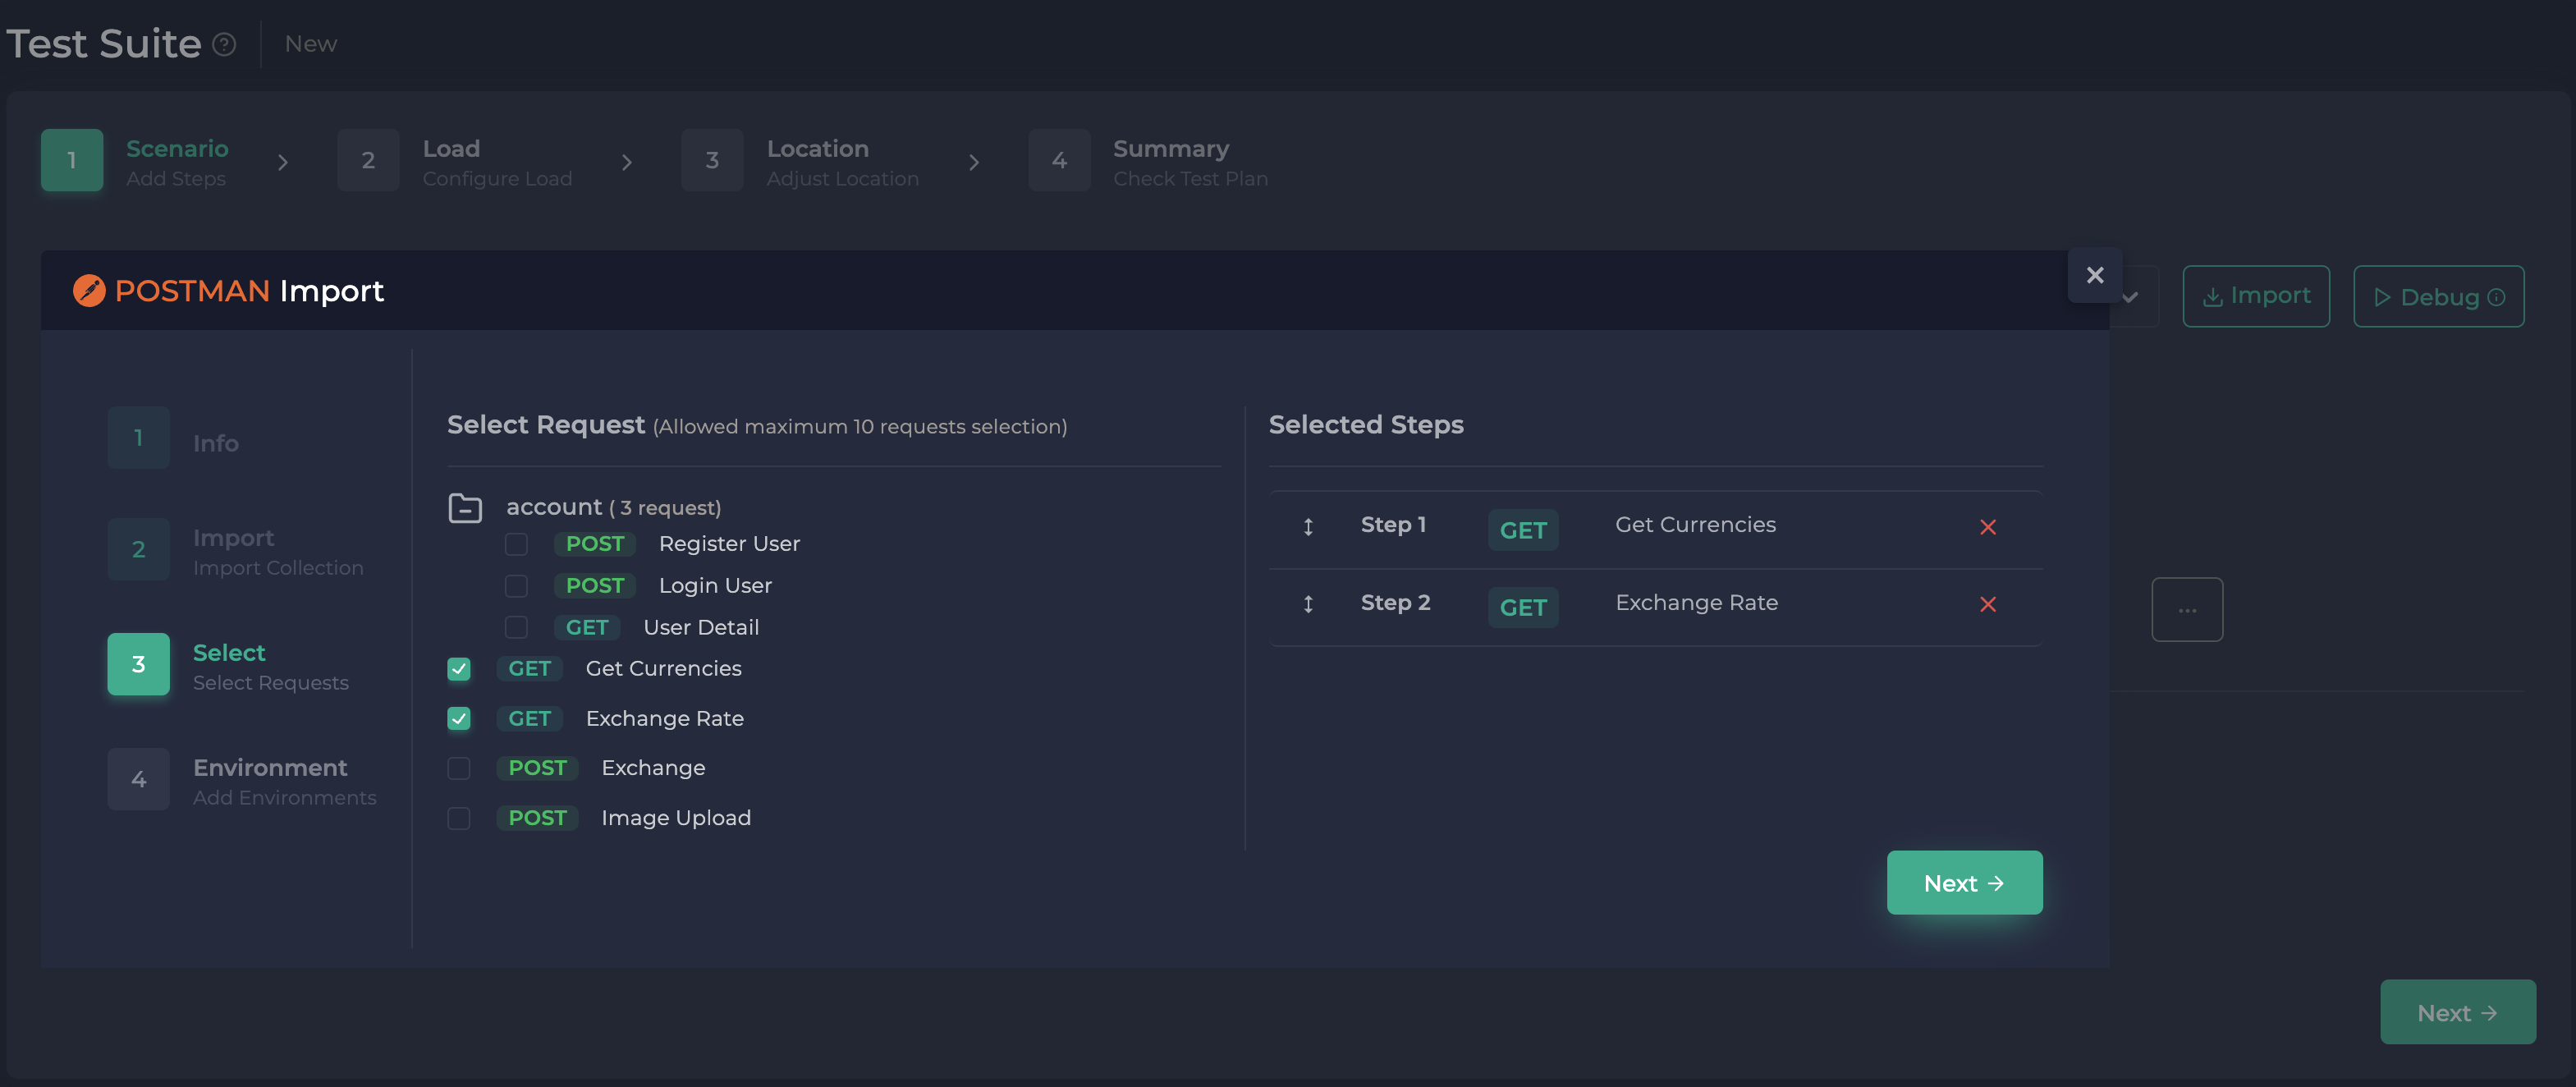
- Now, select the requests you want to import into Ddosify from the left side of your screen. After that, sort out these requests on the right side by drag-and-drop to create a user flow. Ddosify will then import the requests based on the order you've set on the right side.
If your Postman Collection uses environment variables, Ddosify allows you to import these variables too. Once imported, Ddosify converts the Postman Environment to a Ddosify Environment and associates it with the relevant test.
In Postman Collections, you can use environment variables to store and reuse values in your requests and scripts. For example, you can use an environment variable to store the base URL of your API, which you can then use in all your requests. You can also use environment variables to store values that change frequently, such as authentication tokens or IDs.
In our environmnet file, we have an environment variable called
base_urlthat stores the base URL of our API.
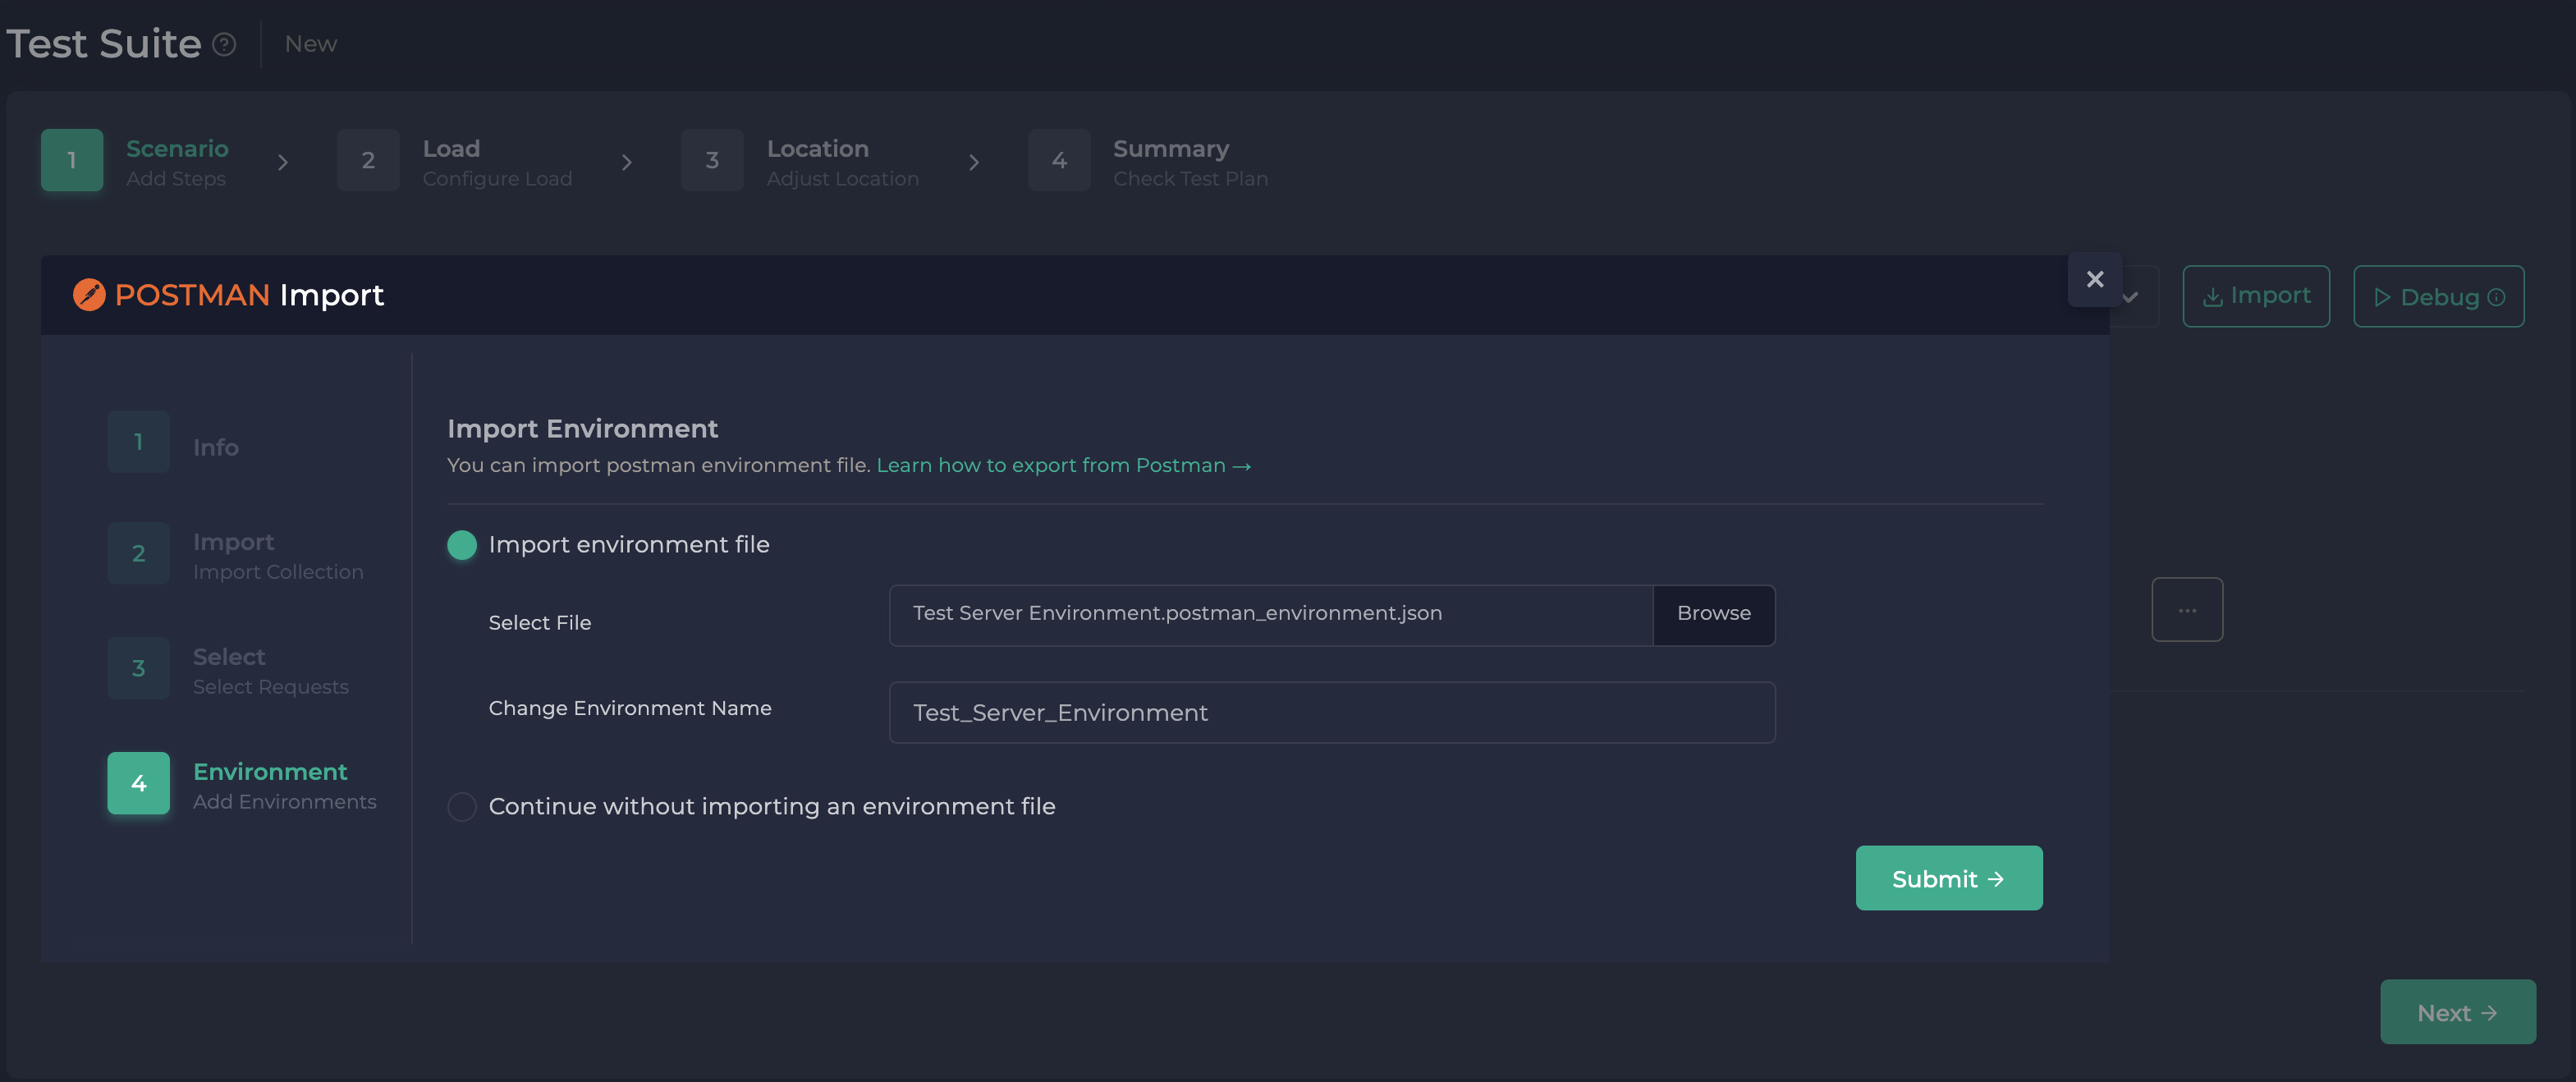
When you import your Postman Collection, Ddosify will automatically create an environment variable with the same name and value. You can then use this variable in your test steps. You can also create your own environment variables in Ddosify. For more information, check out the Environment Variables documentation.
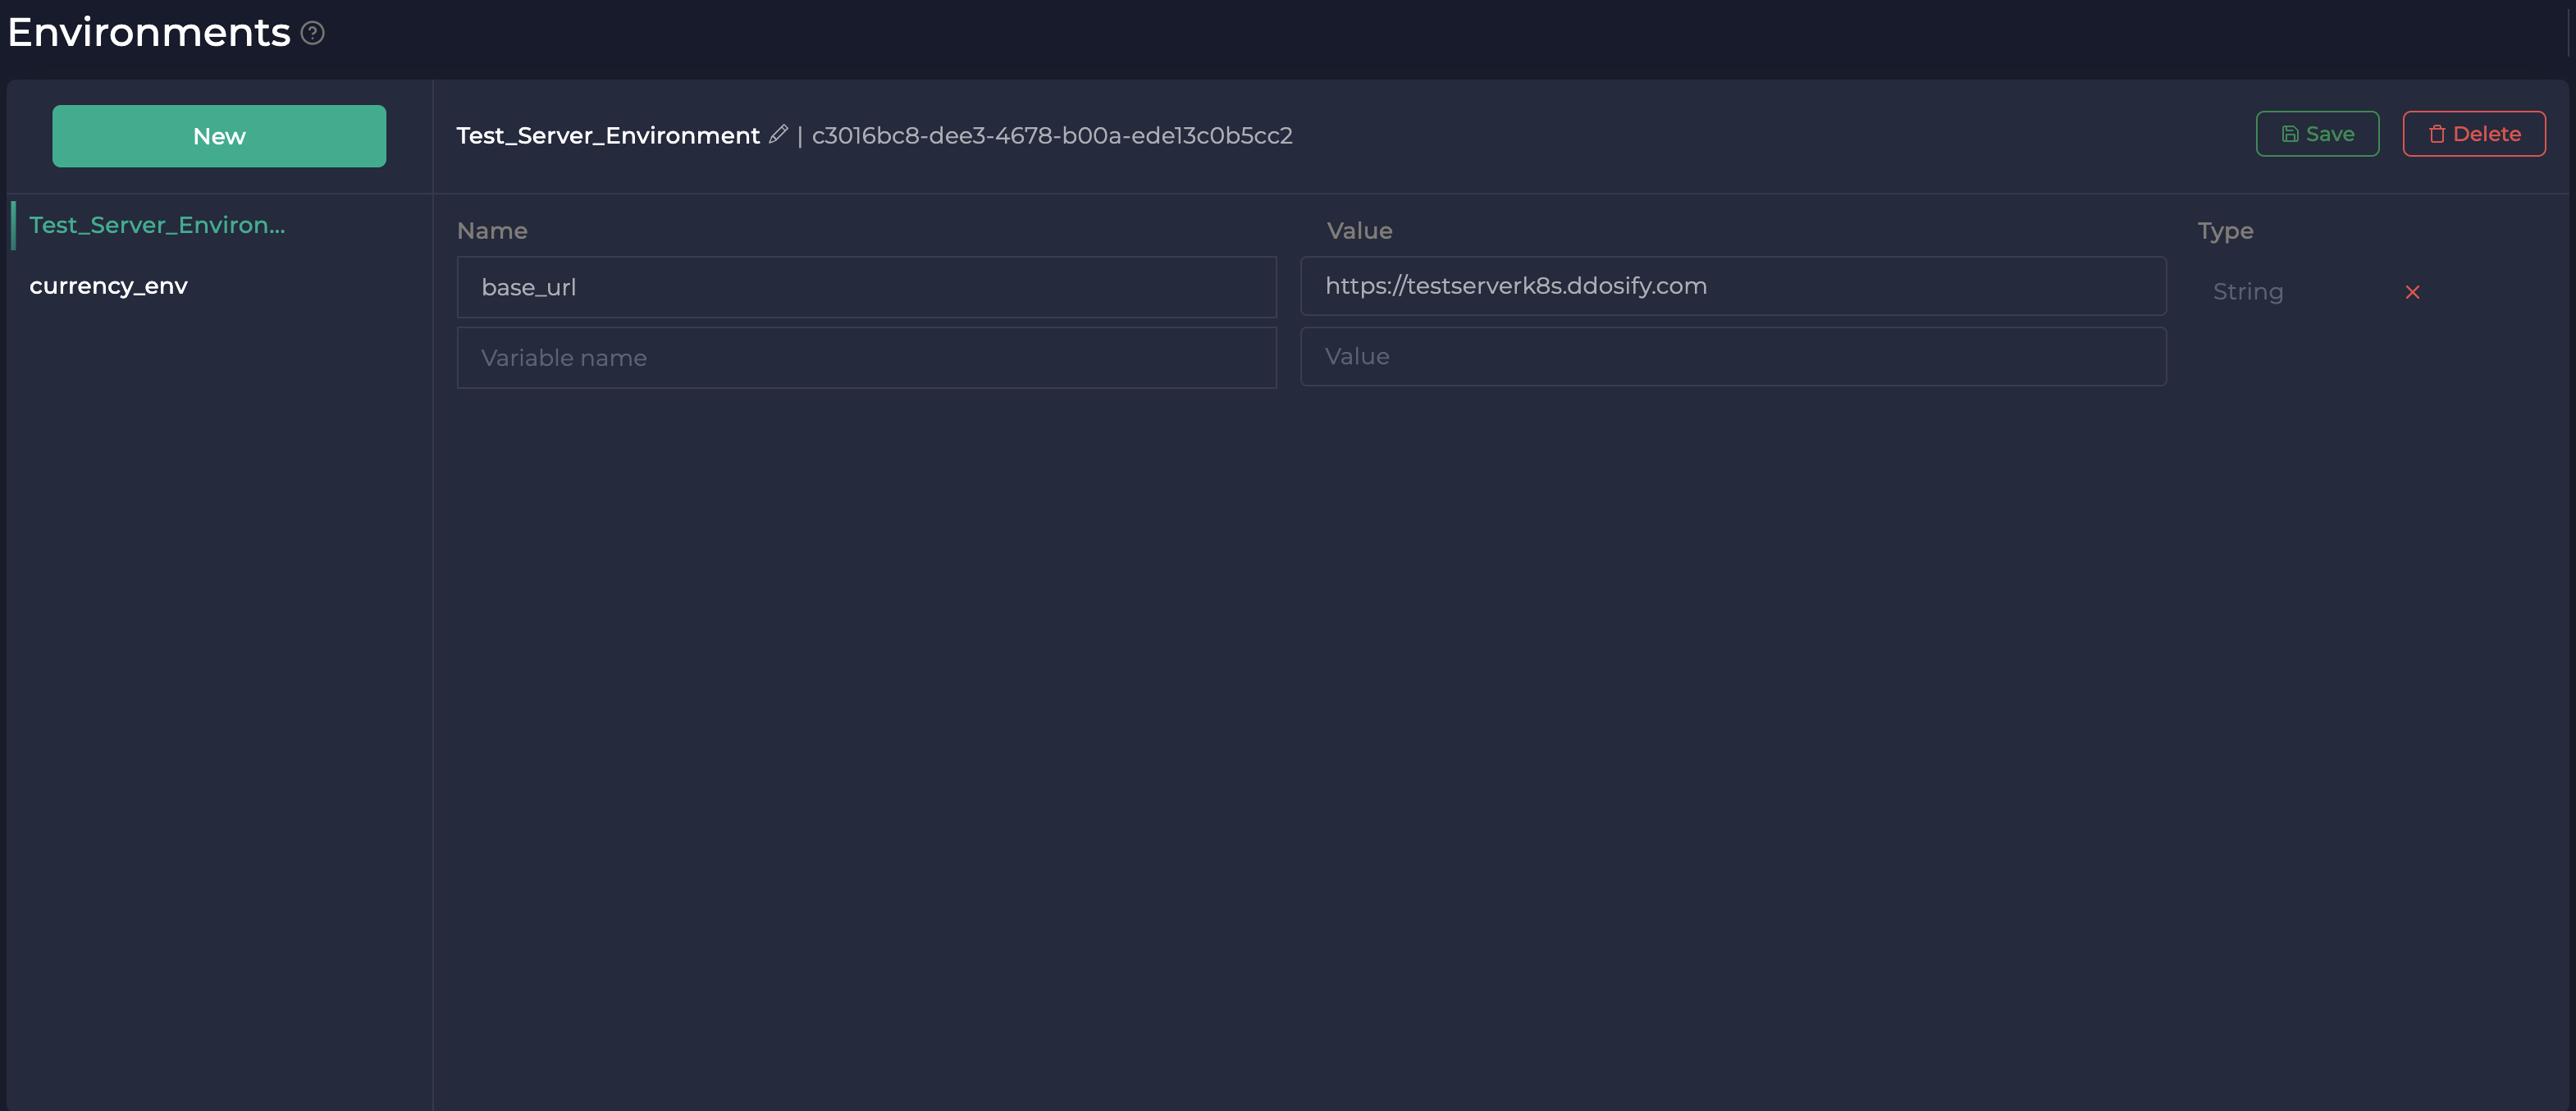
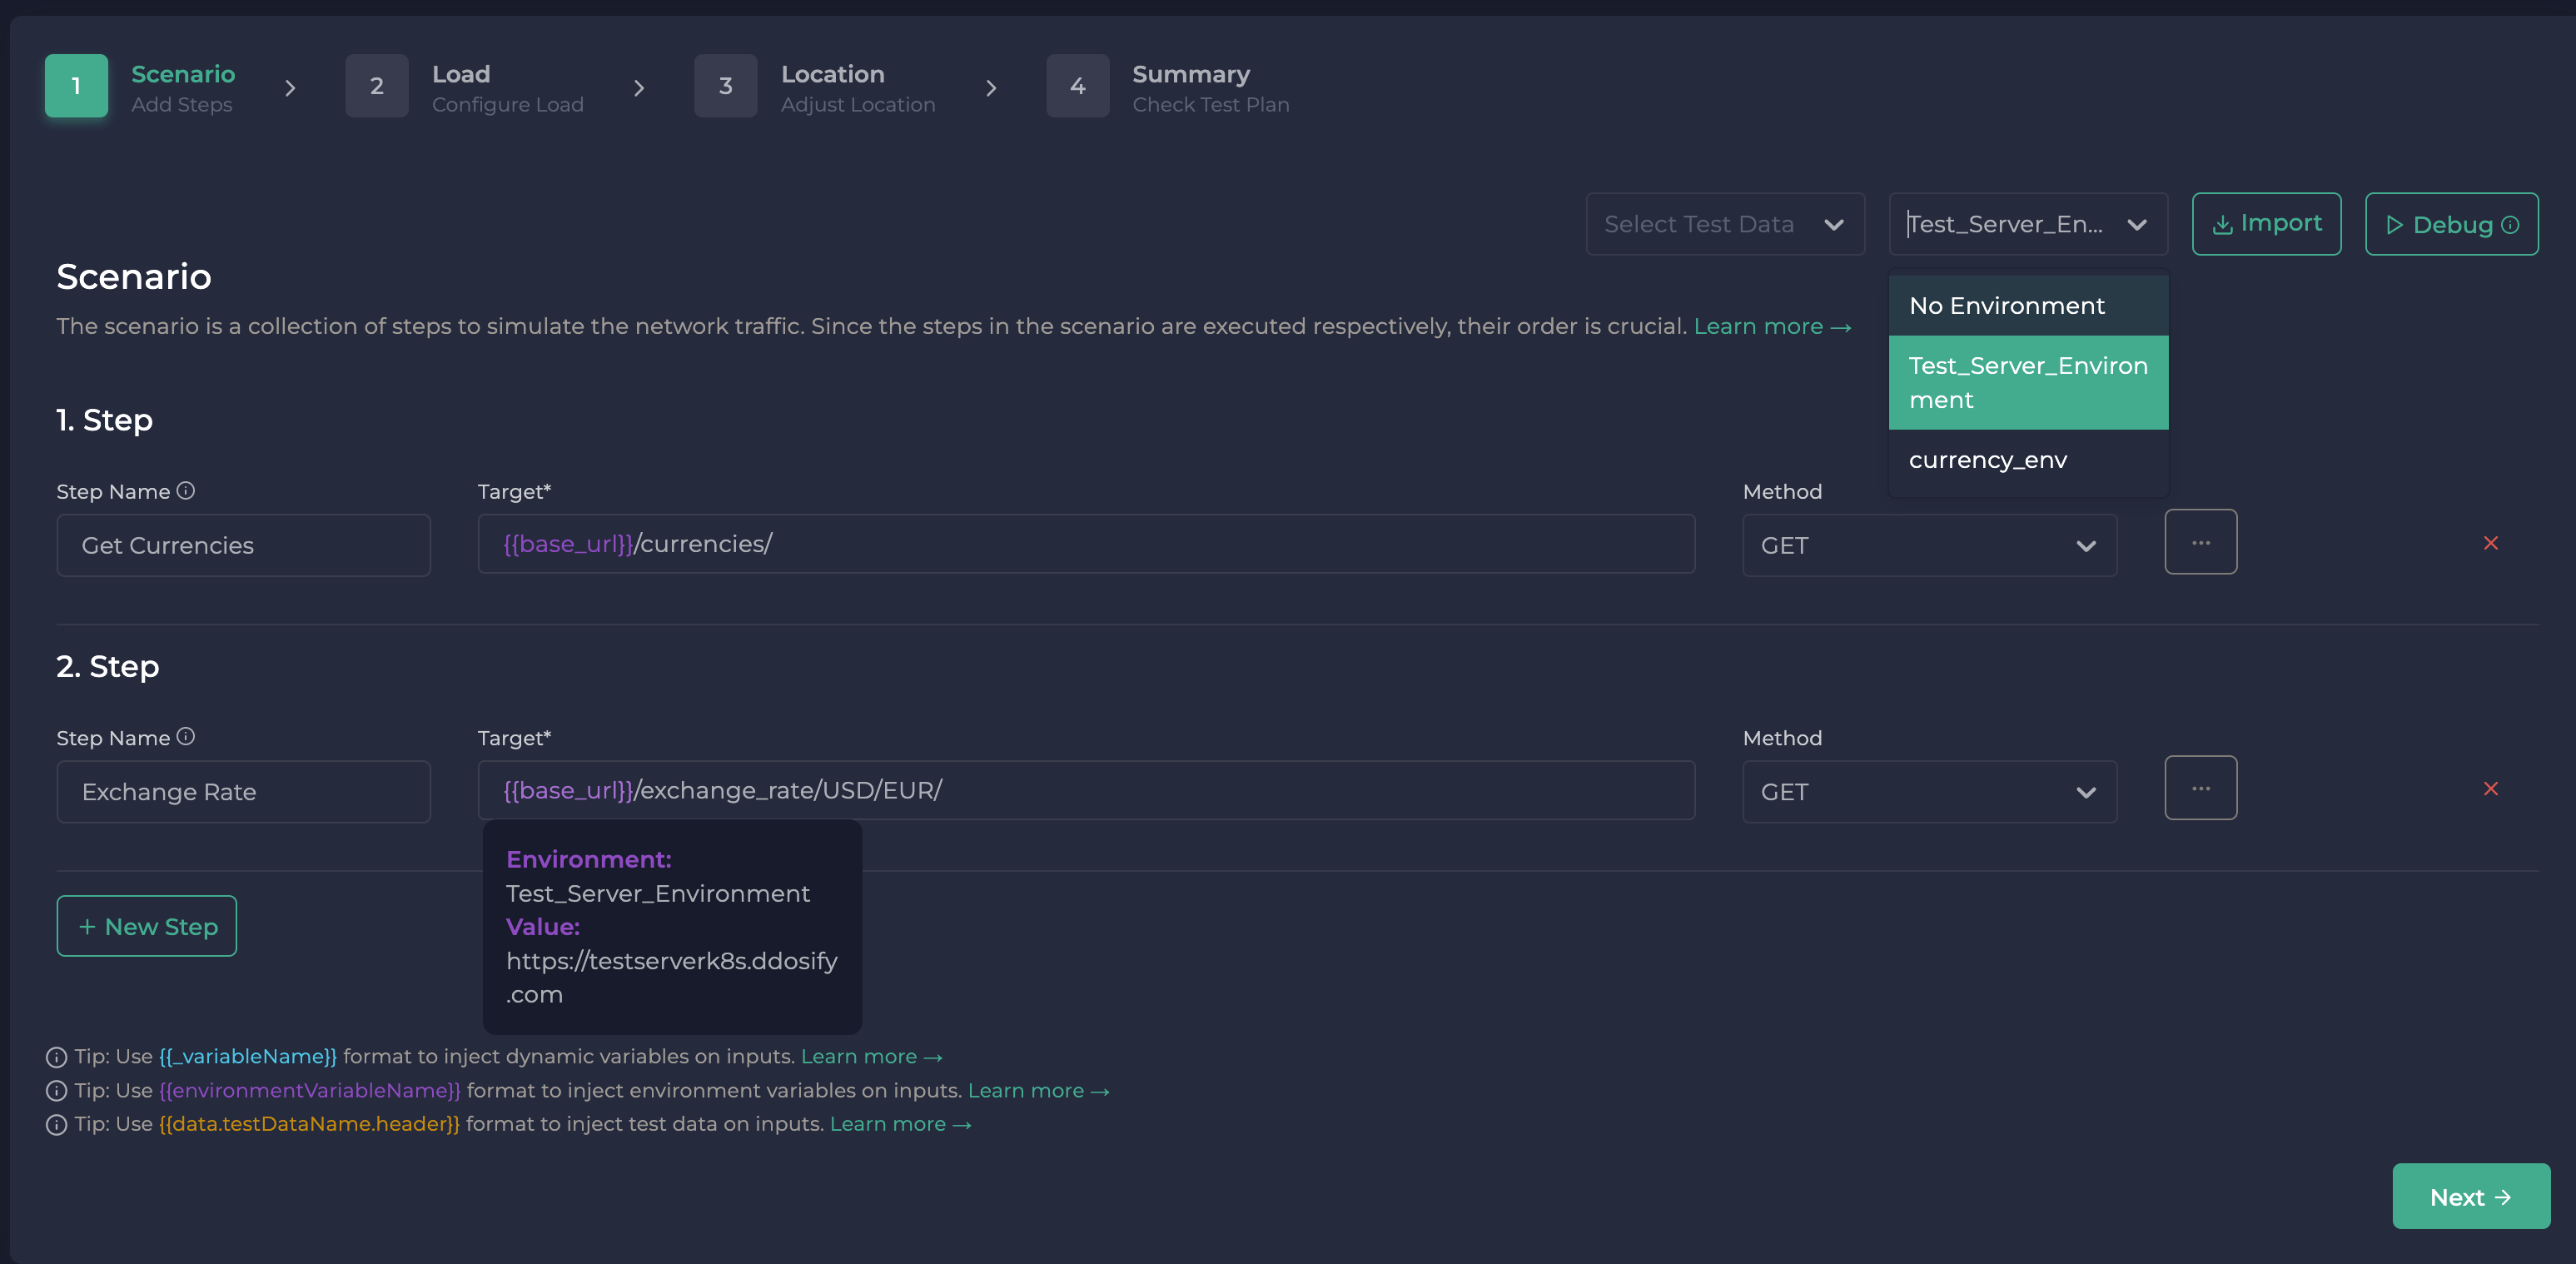
As you see in the image below, we have an environment variable called base_url that stores the base URL of our API.
- Finally, hit the 'Submit' button, and Ddosify will create the scenario as per your specifications.
Debugging
It's a good practice to test your scenario before starting a load test, for which Ddosify provides a debug feature. Its purpose is to execute the scenario once, presenting the details of both, the packets sent and received, along with the environment variables, test data and any variables captured during all steps. Using the Debug requests feature within the Ddosify Cloud platform won't lead to any charges.
To Debug a Scenario, follow these steps:
- Open the Ddosify App, navigate to the Test Suite and look for the 'Debug' button in the upper-right corner, then click on it.
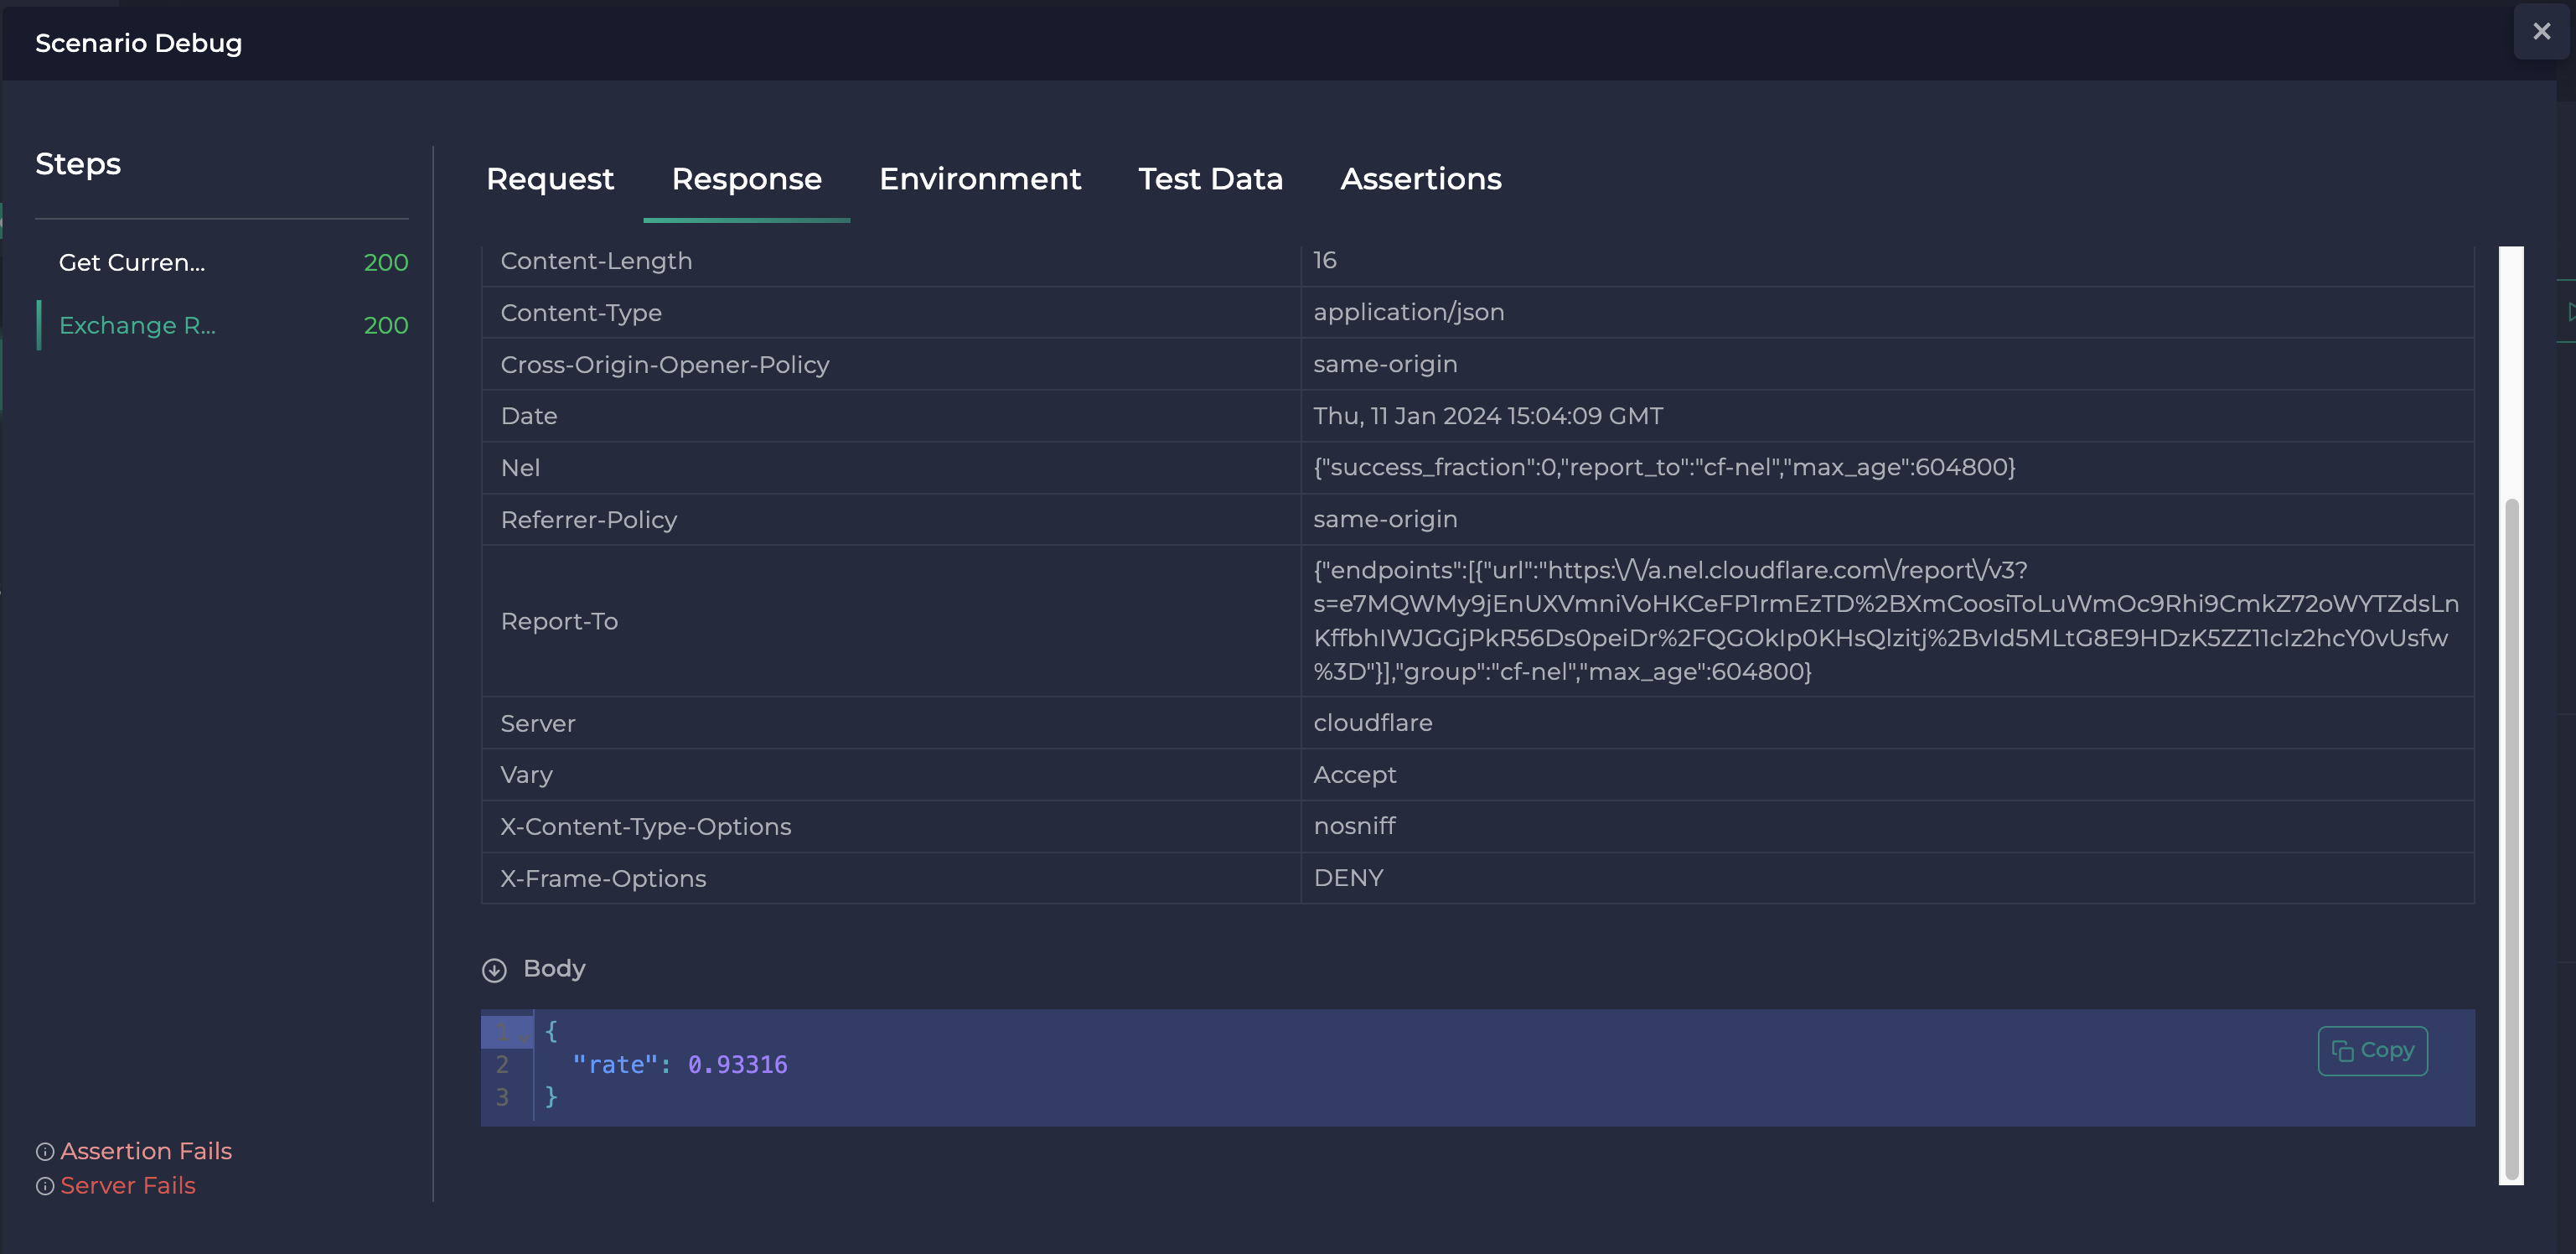
- After the debug process finishes, a dialog box pops up with all the essential information you need, helping you critically inspect your configuration.
Request tab:
Request URLis the URL of the request.Request Methodis the HTTP method of the request.Request Headersare the headers of the request.Request Bodyis the body of the request. etc.
Response tab:
Response Statusis the HTTP status code of the response.Response Headersare the headers of the response.Response Bodyis the body of the response. etc.
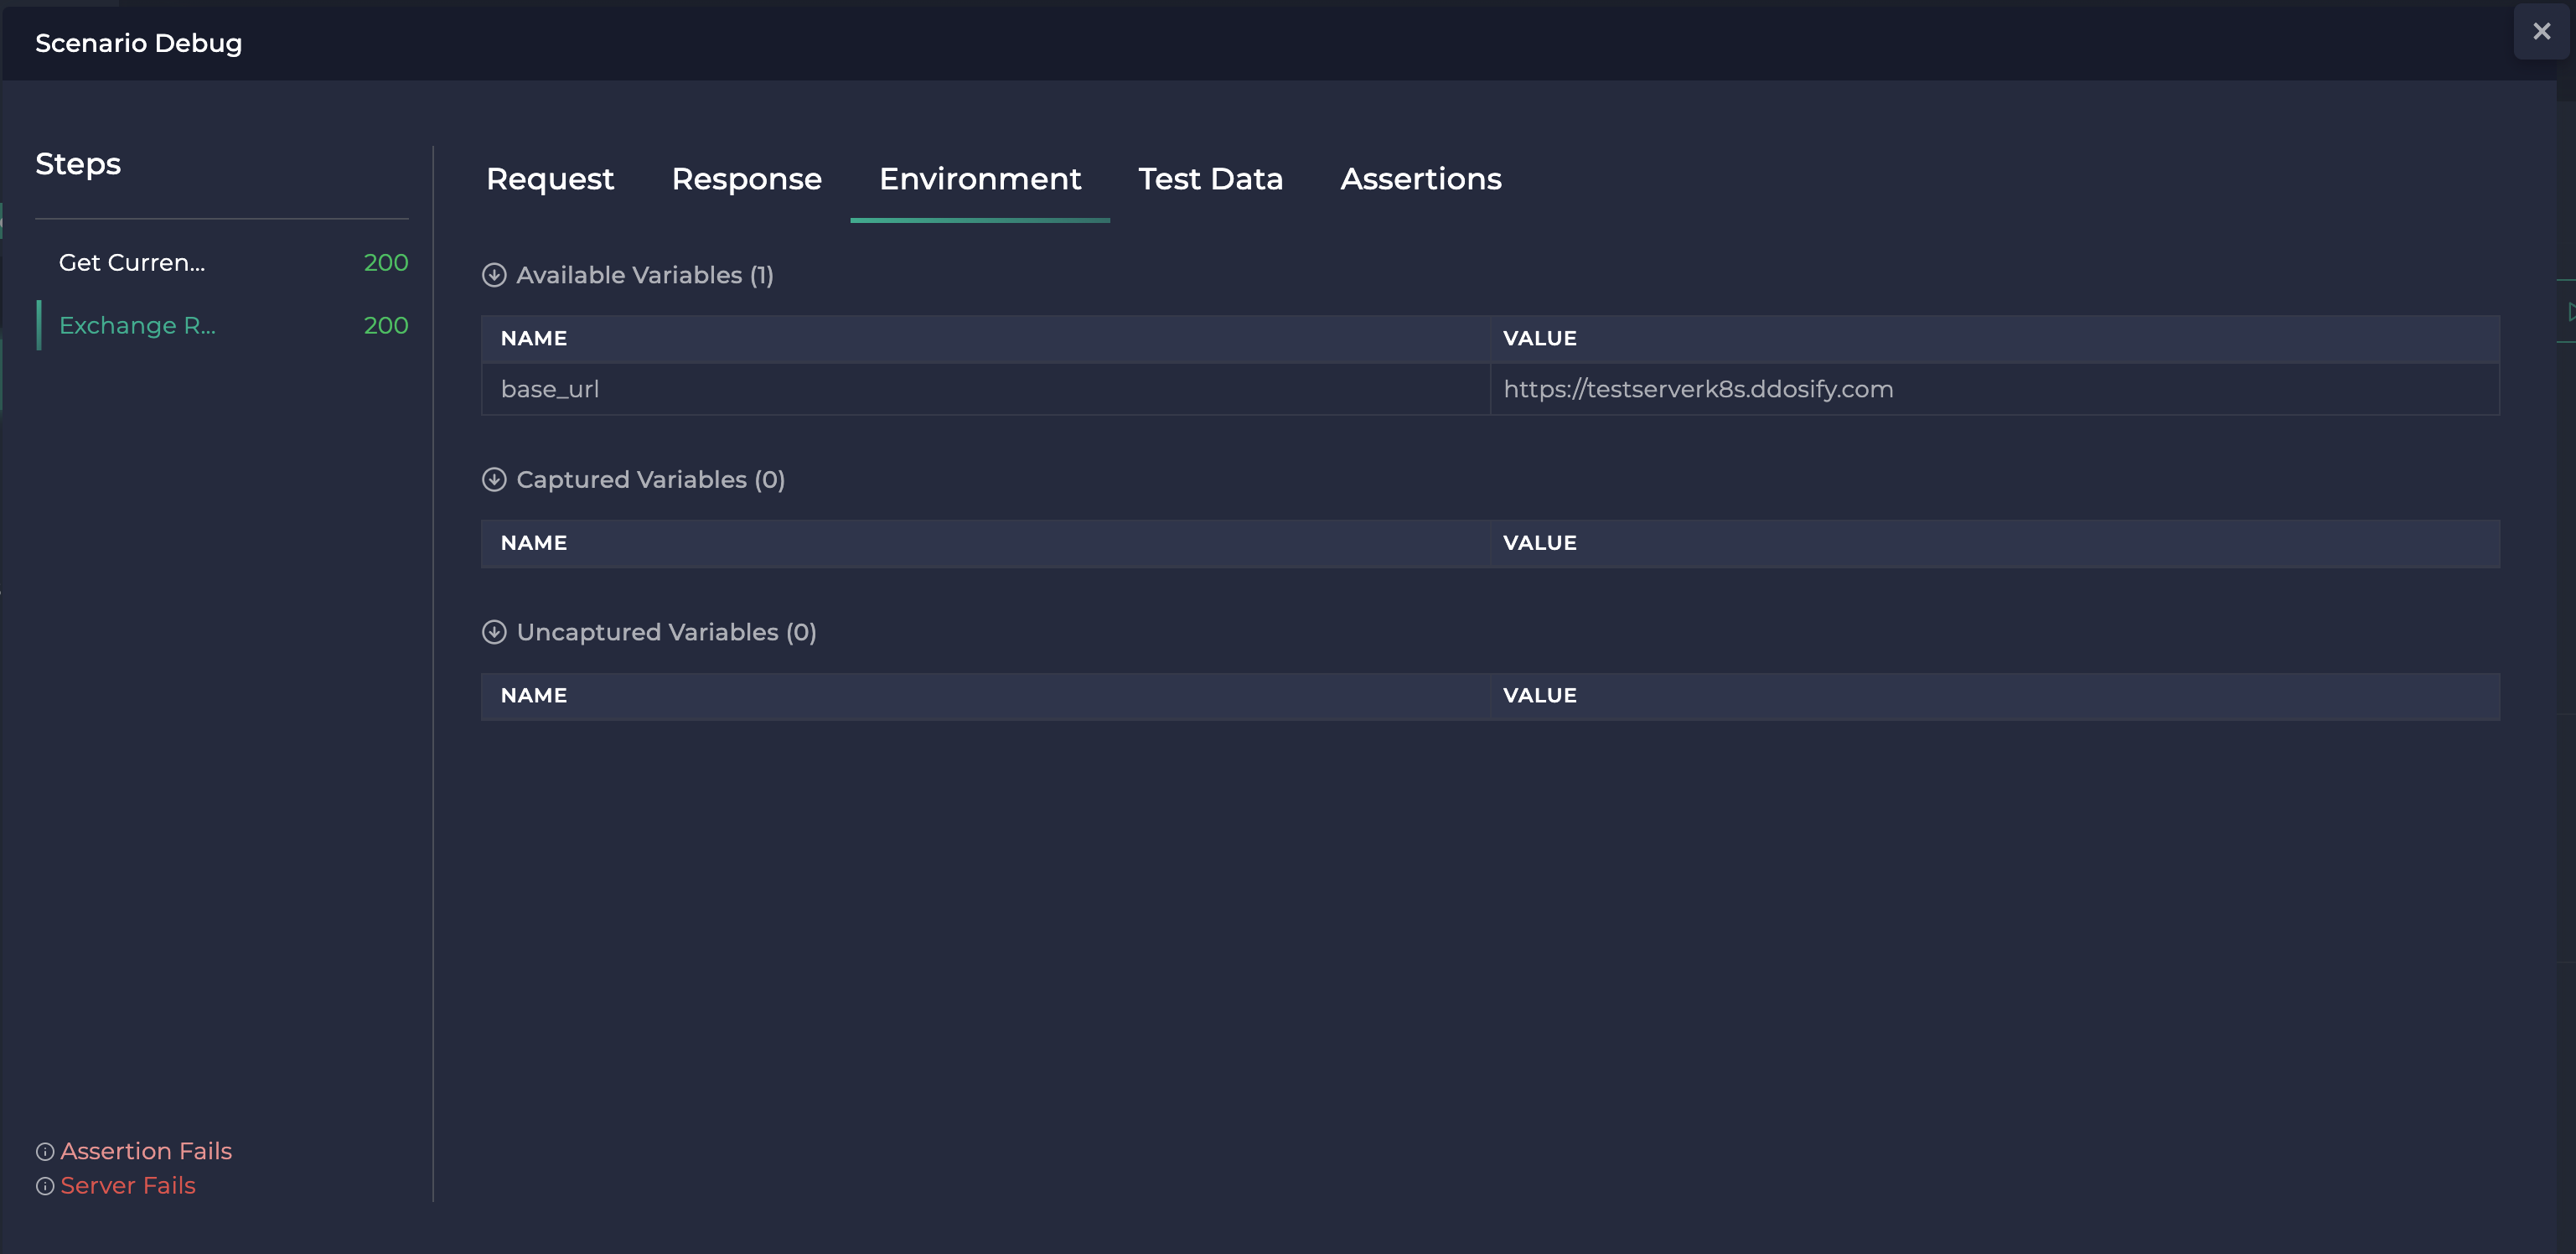
Environment tab:
Available Variablesare the environment variables of the scenario which we have used base_url.Captured Variablesare the captured variables of the scenario. etc.Uncaptured Variablesare the uncaptured variables of the scenario. etc.
Test Data tab:
Available Test Datarepresents importing your CSV-formatted Test Data into the Ddosify Platform and incorporate it into your scenarios for more realistic testing experiences.
Assertions tab:
At default, Ddosify marks the step result as successful if it sends the request and receives the response without any network error happening. Status code, body type (or content), or other metrics does not have any effect on success/failure criteria. But this may not be a good test result for your use case and you may want to create your success/fail logic. That's where you can use Assertions.
Using the no-code capabilities of the Ddosify Platform, you can easily create assertion logic based on various factors, such as status code, response time, response size, response body, response header, or captured variables. Additionally, you can combine multiple assertions to develop more intricate logic.
Environment
Similar to Postman, Ddosify Platform also offers a feature called Environment Variables. This helps you store constants in variables, providing an easier way to use them in your test scenarios.
Creating Environment Variable:
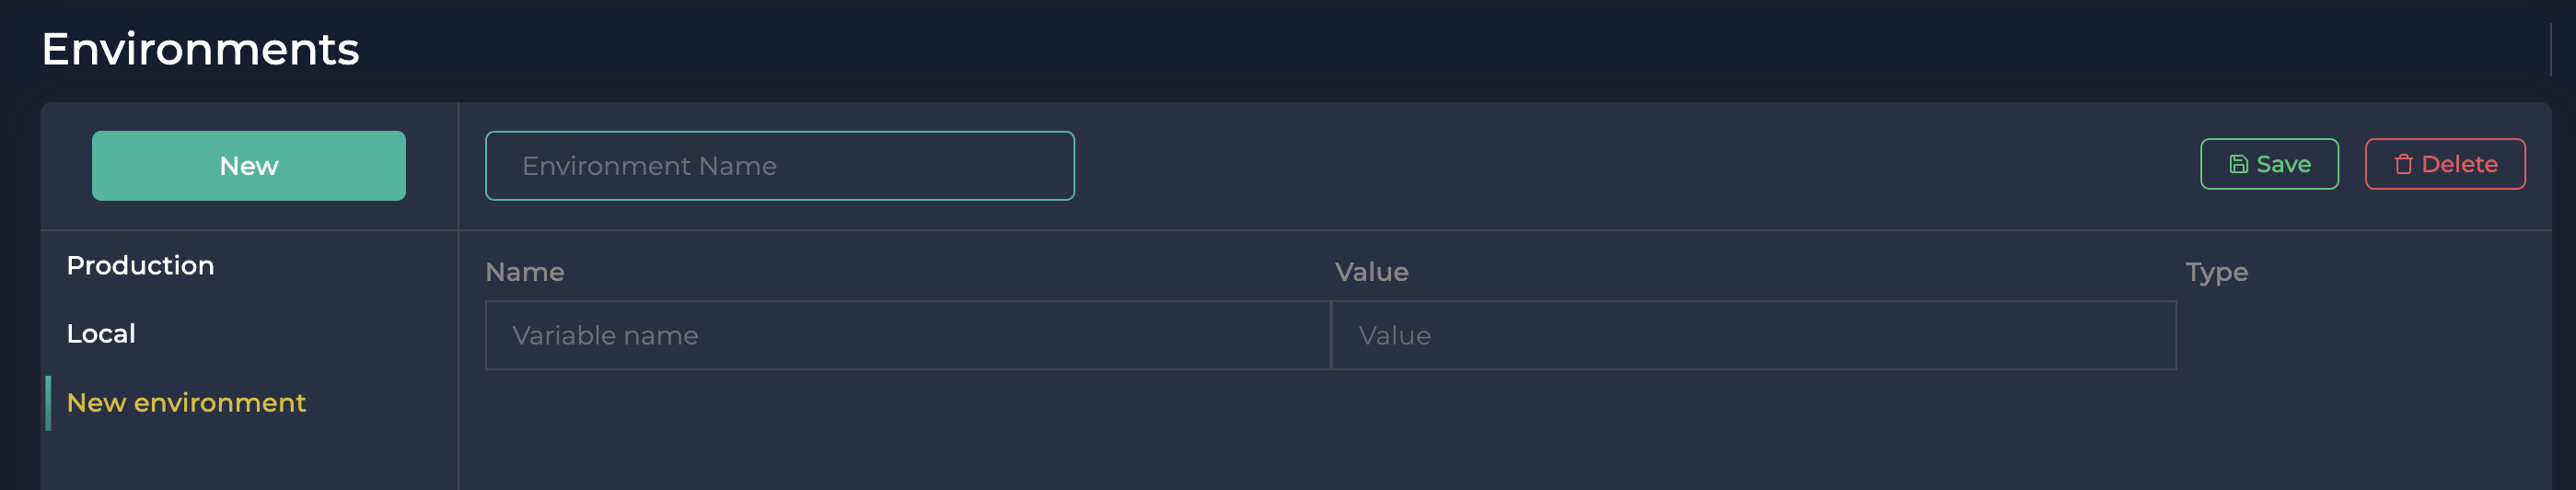
- Go to the Environments listing page in the Ddosify App and click on the 'New' button, positioned at the top left corner of the page.
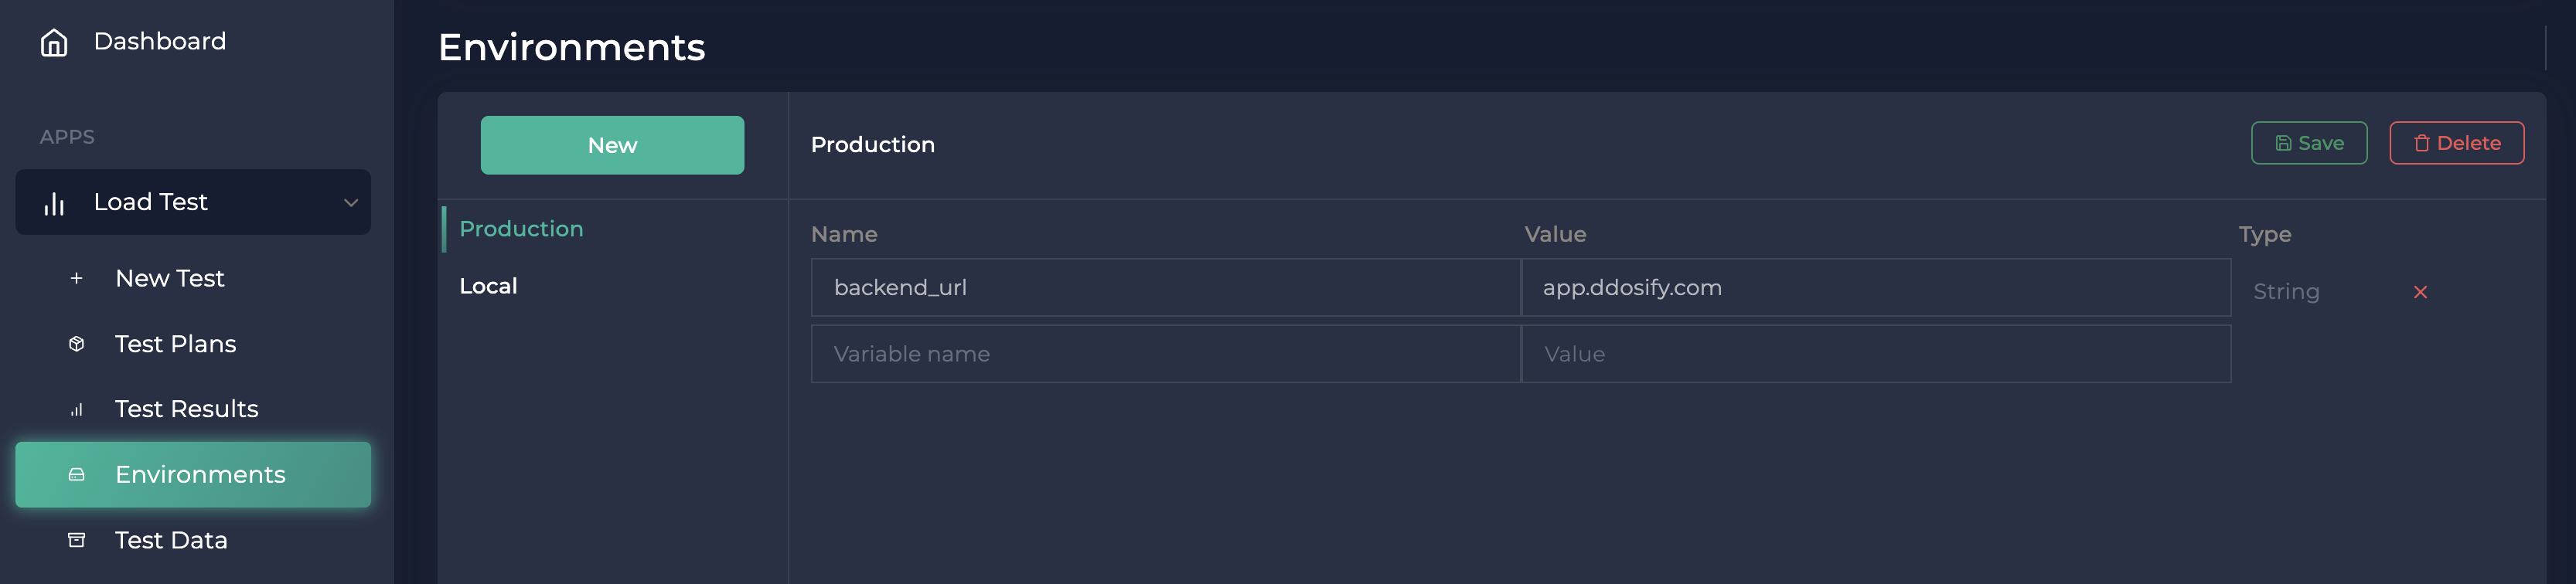
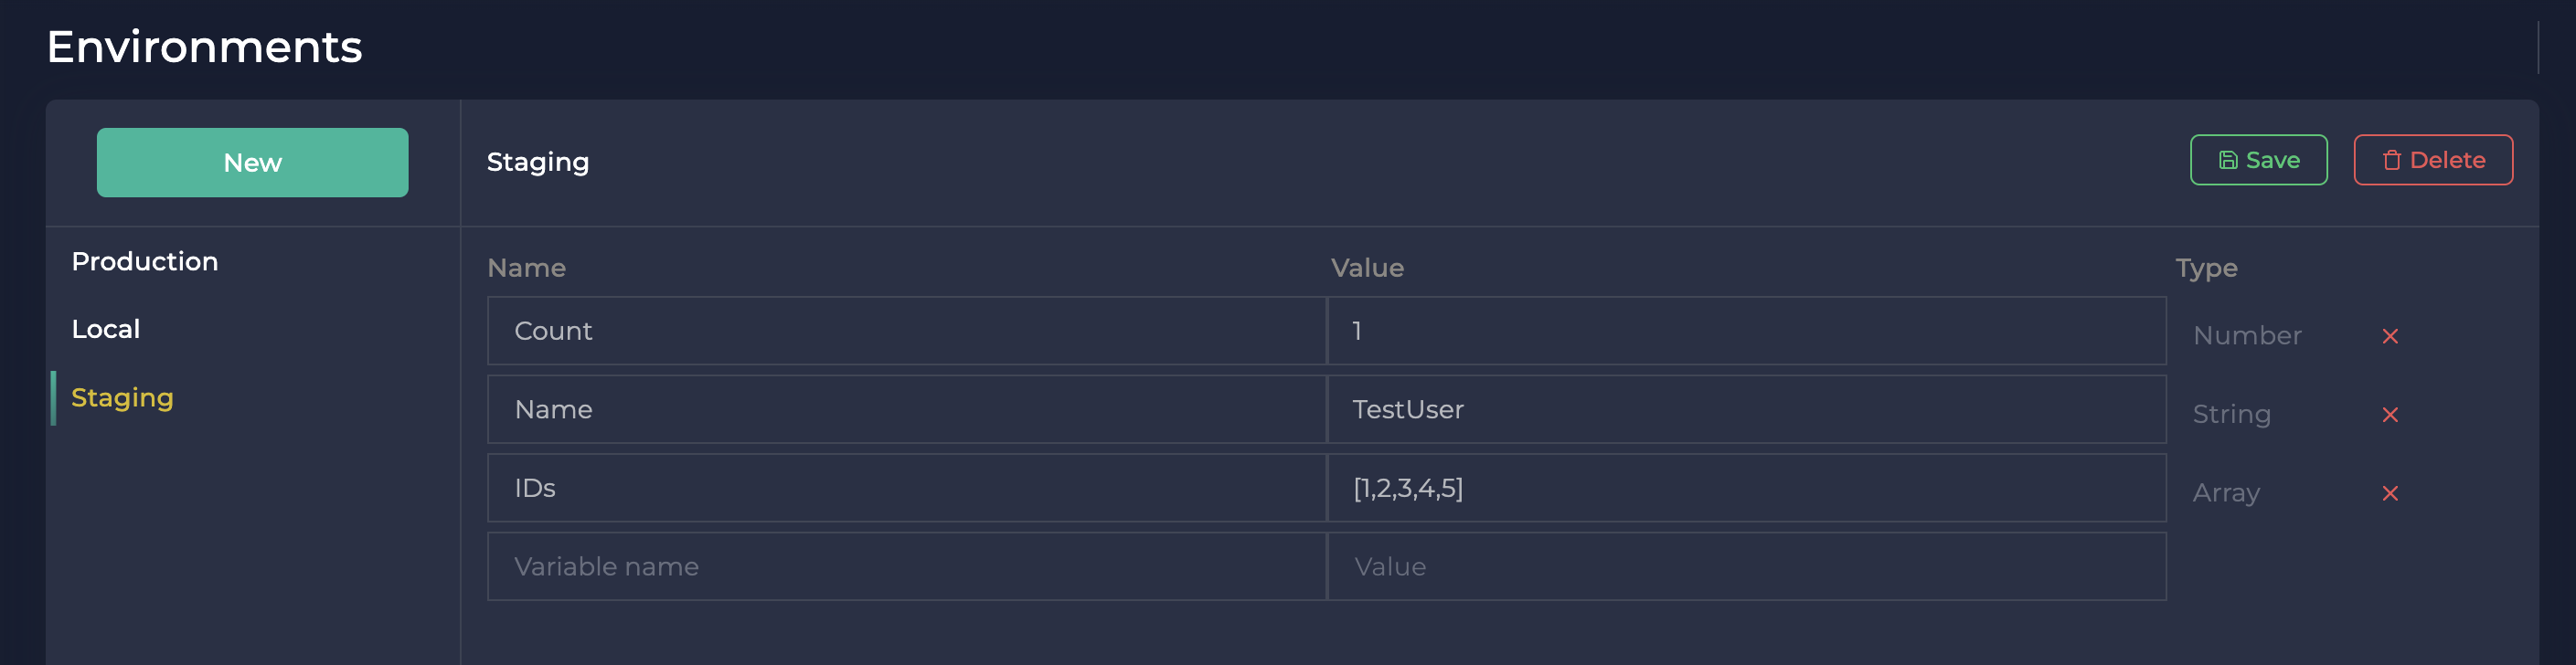
- Provide a unique name for the new environment, which will help you link the environment to a test. Then, create your pairs of names and values. The value types can be Number, String, or Array.
- In our example, we have imported the Postman Environment called as
Test_Server_Environmentwhich has an environment variable calledbase_urlthat stores the base URL of our API. We can use this variable in our test steps.
Binding an Environment to Tests:
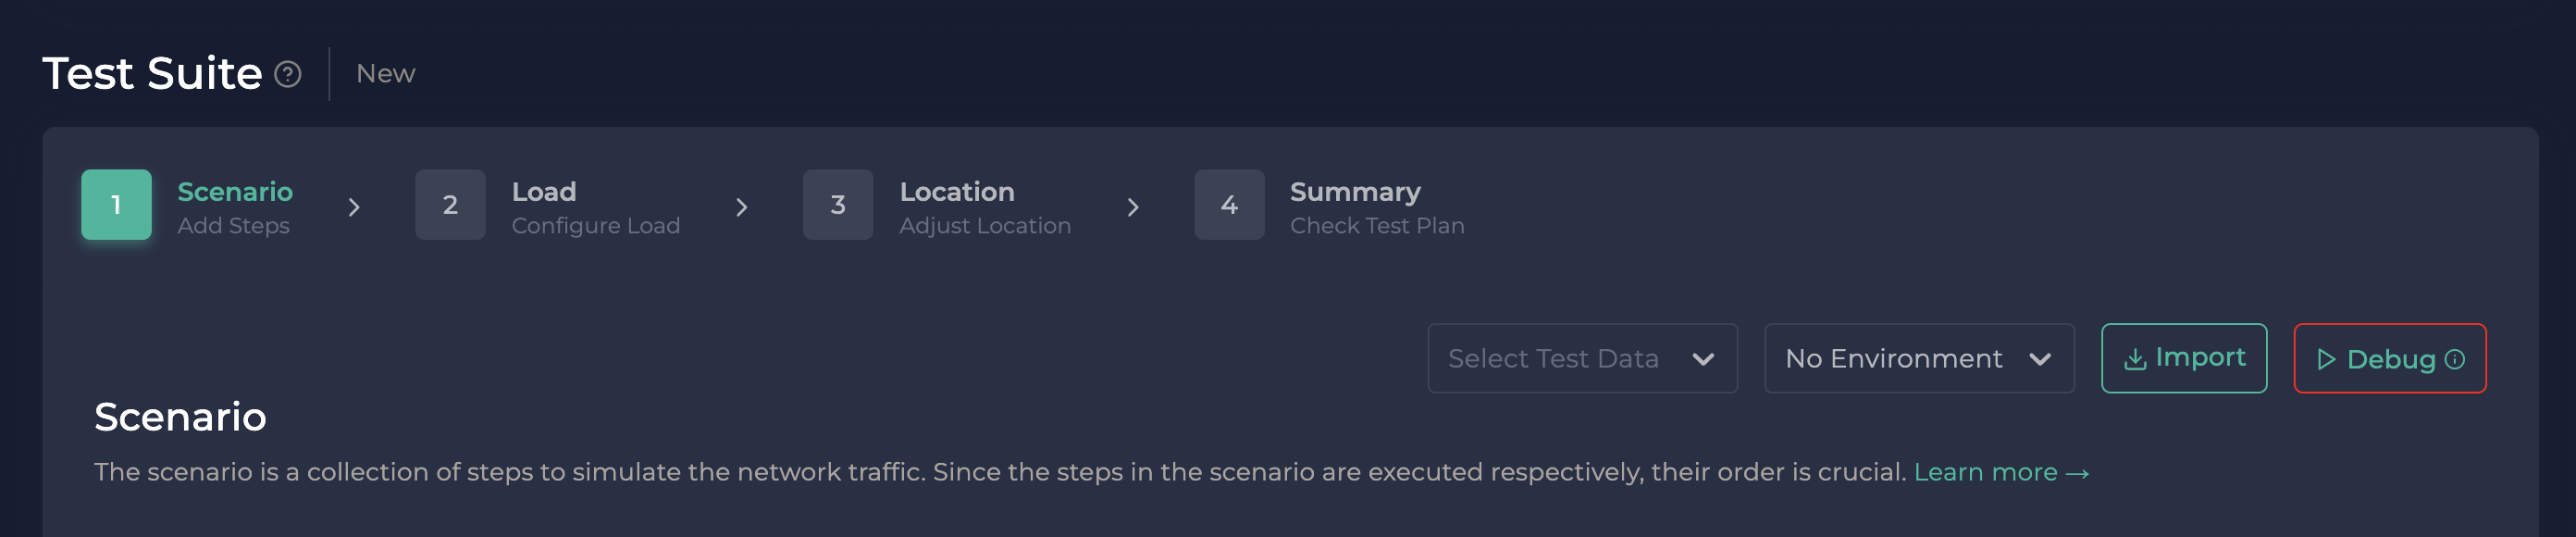
- Open the Ddosify App, move to the Test Suite, and select the Environment you have just created from the dropdown menu in the top-right corner of the Test Suite.
- Use the
{{environmentVariableName}}syntax to add test data to either URL, headers, query parameters, or authentication. For more information, check out the Environment Variables documentation.
Load Test
Ddosify is a powerful tool for Kubernetes Monitoring and Performance Testing that can be used to determine how a system behaves under both normal and anticipated peak load conditions in your web and mobile applications, APIs, and microservices. Ddosify is also offering a variety of advanced global and local features. It can generate network traffic from 25 different countries, providing comprehensive global load zone data. For ease of usability and integration, it offers a no-code platform which allows you to craft user scenarios beyond correlation and assertion, while the extensive API support facilitates smooth integration and automation. Moreover, Ddosify furthers its commitment to detailed insights by offering city-level testing from over 60 global cities, a feature that ensures precise latency measurement and enriched performance insights.
Let’s start the Load Test.
You can apply same configurations below to your previous imported Postman Collection to Ddosify.
Start Load Test
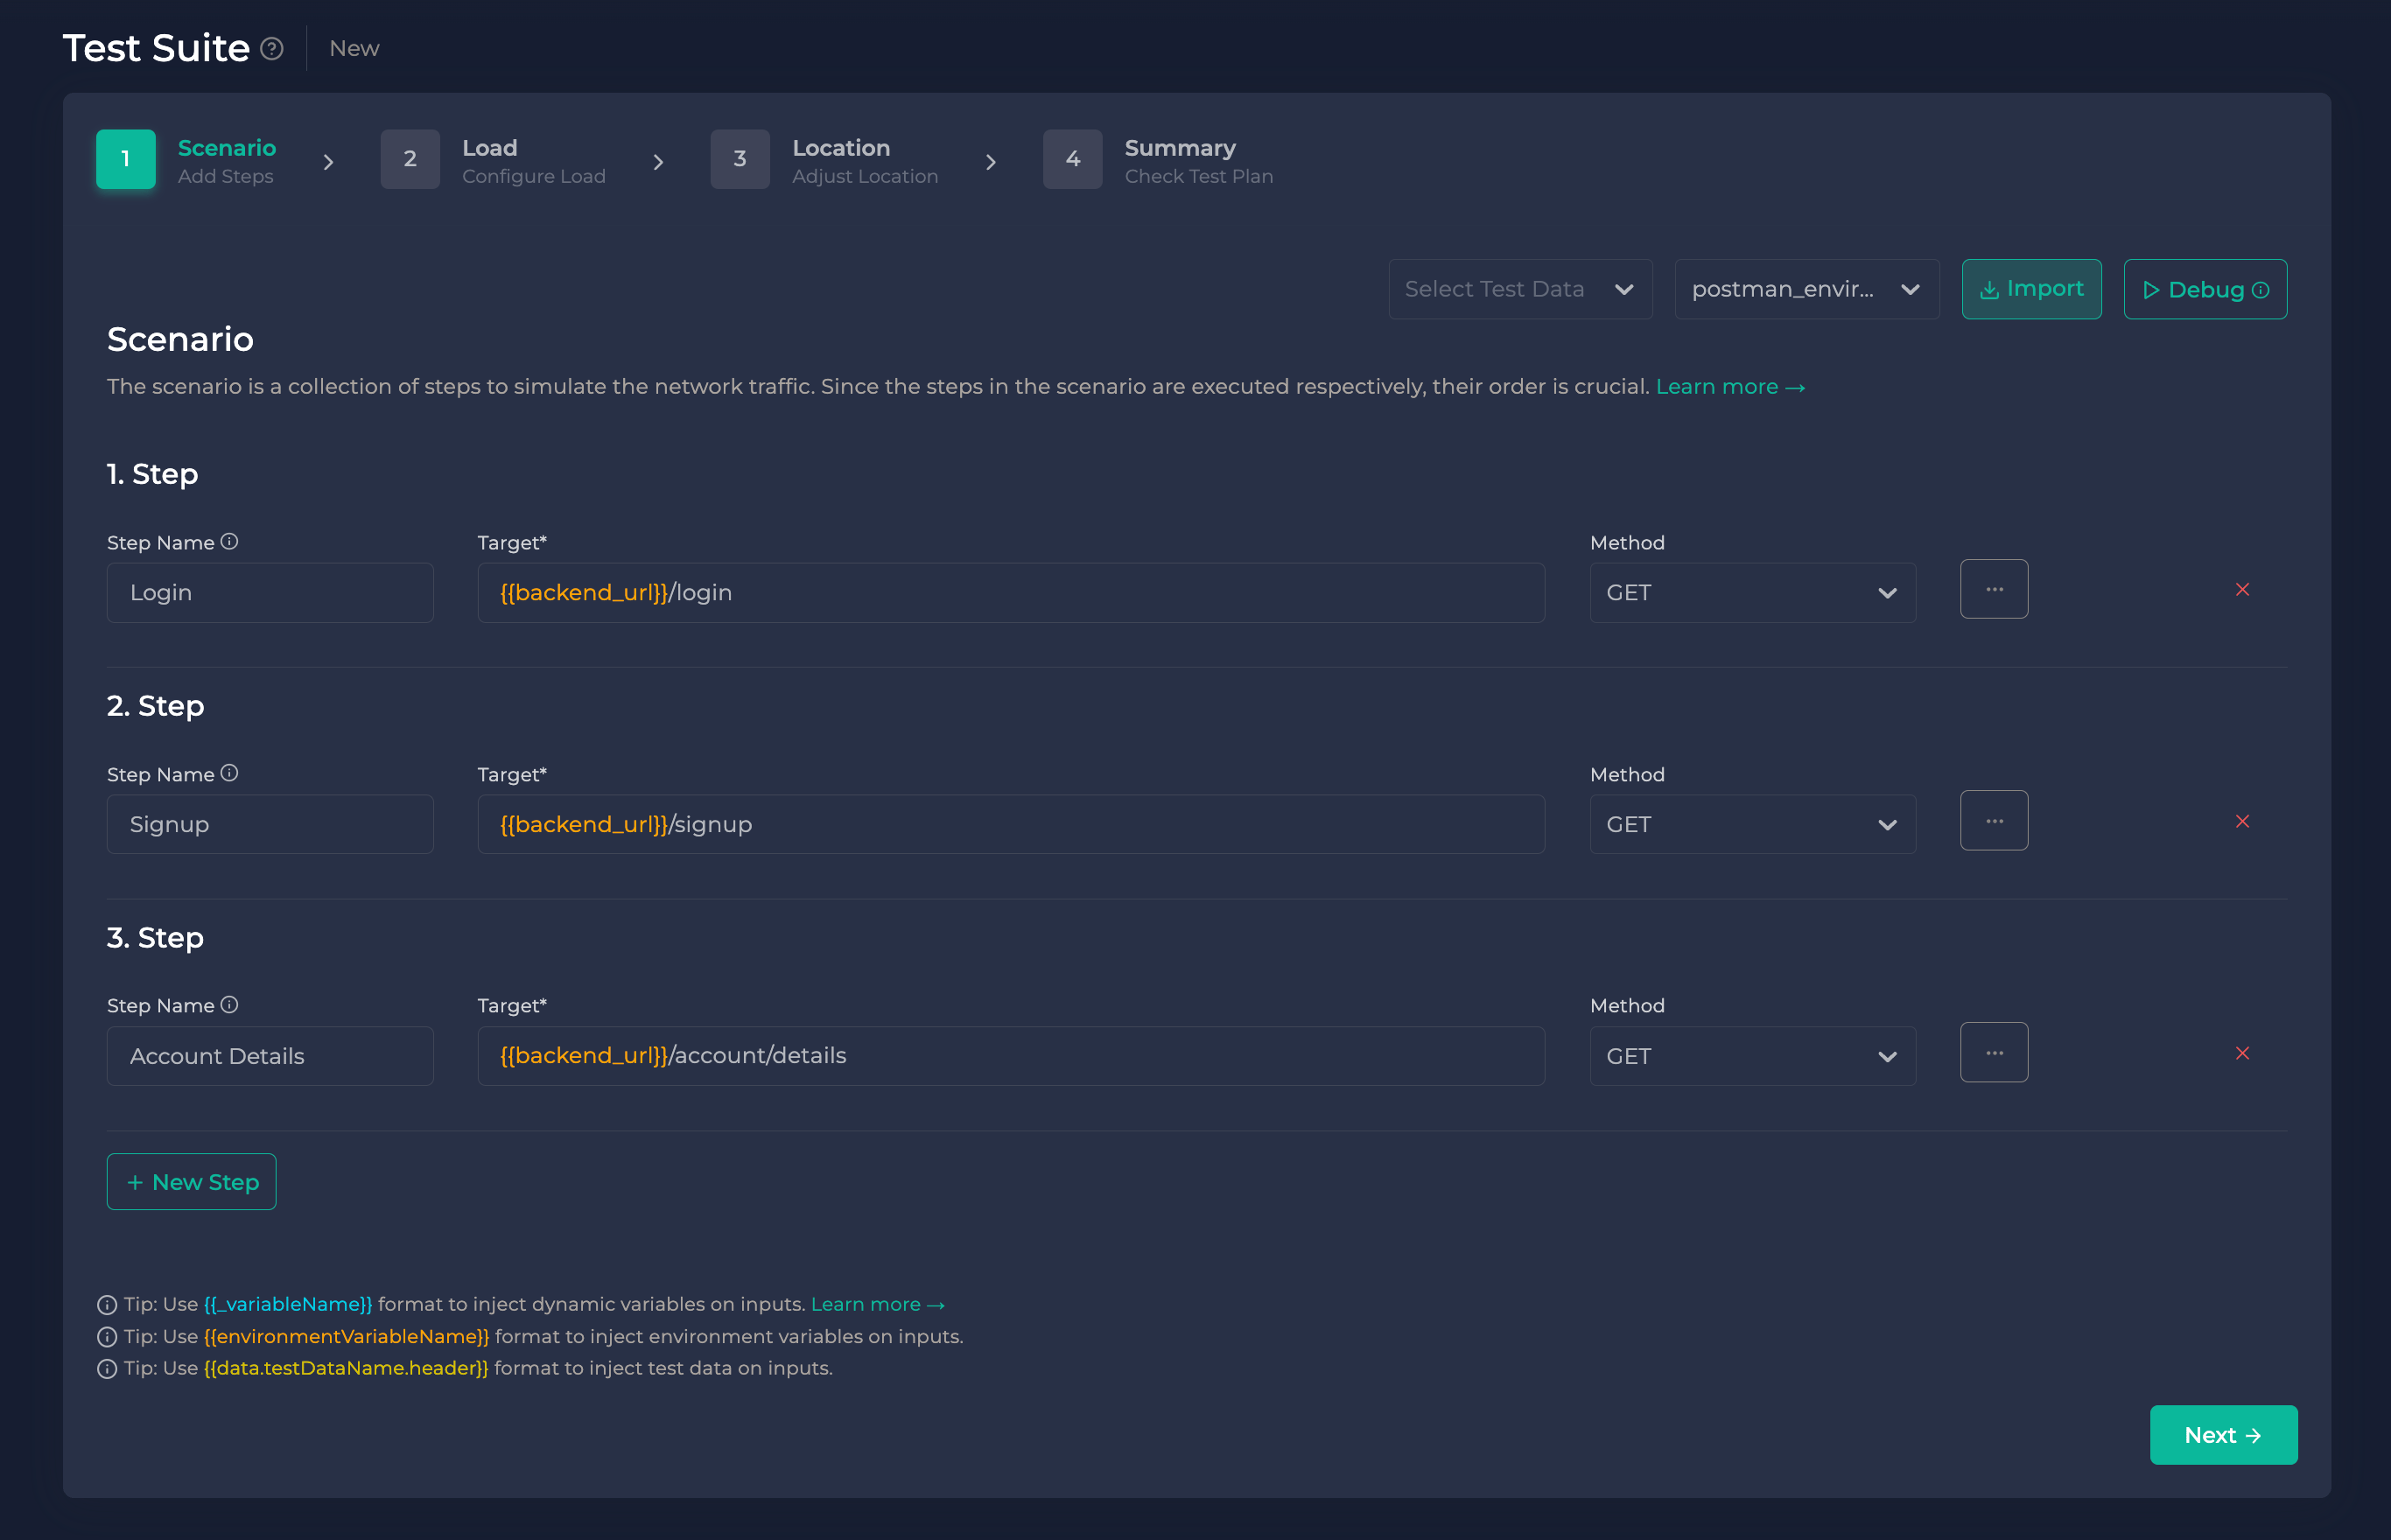
You can create complex and realistic user flows on Ddosify No-code UI. Before starting the load test with postman import data we will cover the following steps.
We are using same Postman Collection that we have imported to Ddosify but with different scenario steps for just demonstration purposes.
Test Suite
Test Suite is the place where the magic happens. It will let you configure scenario steps, iteration count, duration, load type, geographical distributions of the requests, etc. Once you finalize your configurations, you can start the test immediately or save it as Test Plan to use for future tests.
Scenario Flow
What is Scenario?
In essence, a scenario represents a series of steps designed to mimic the actions of an end-user. This end-user could be a real person using a browser to access your website or another software program that sends API requests to your endpoints. For instance, imagine you own an e-commerce business and wish to evaluate the performance of the following user flow:
- User visits the home page
- User logs in
- User adds a product to the shopping cart
To accomplish this, you must construct a scenario containing these 3 steps. It is essential to ensure that the steps are executed in the correct order, as the sequence is critical to accurately simulating the end-user's experience.
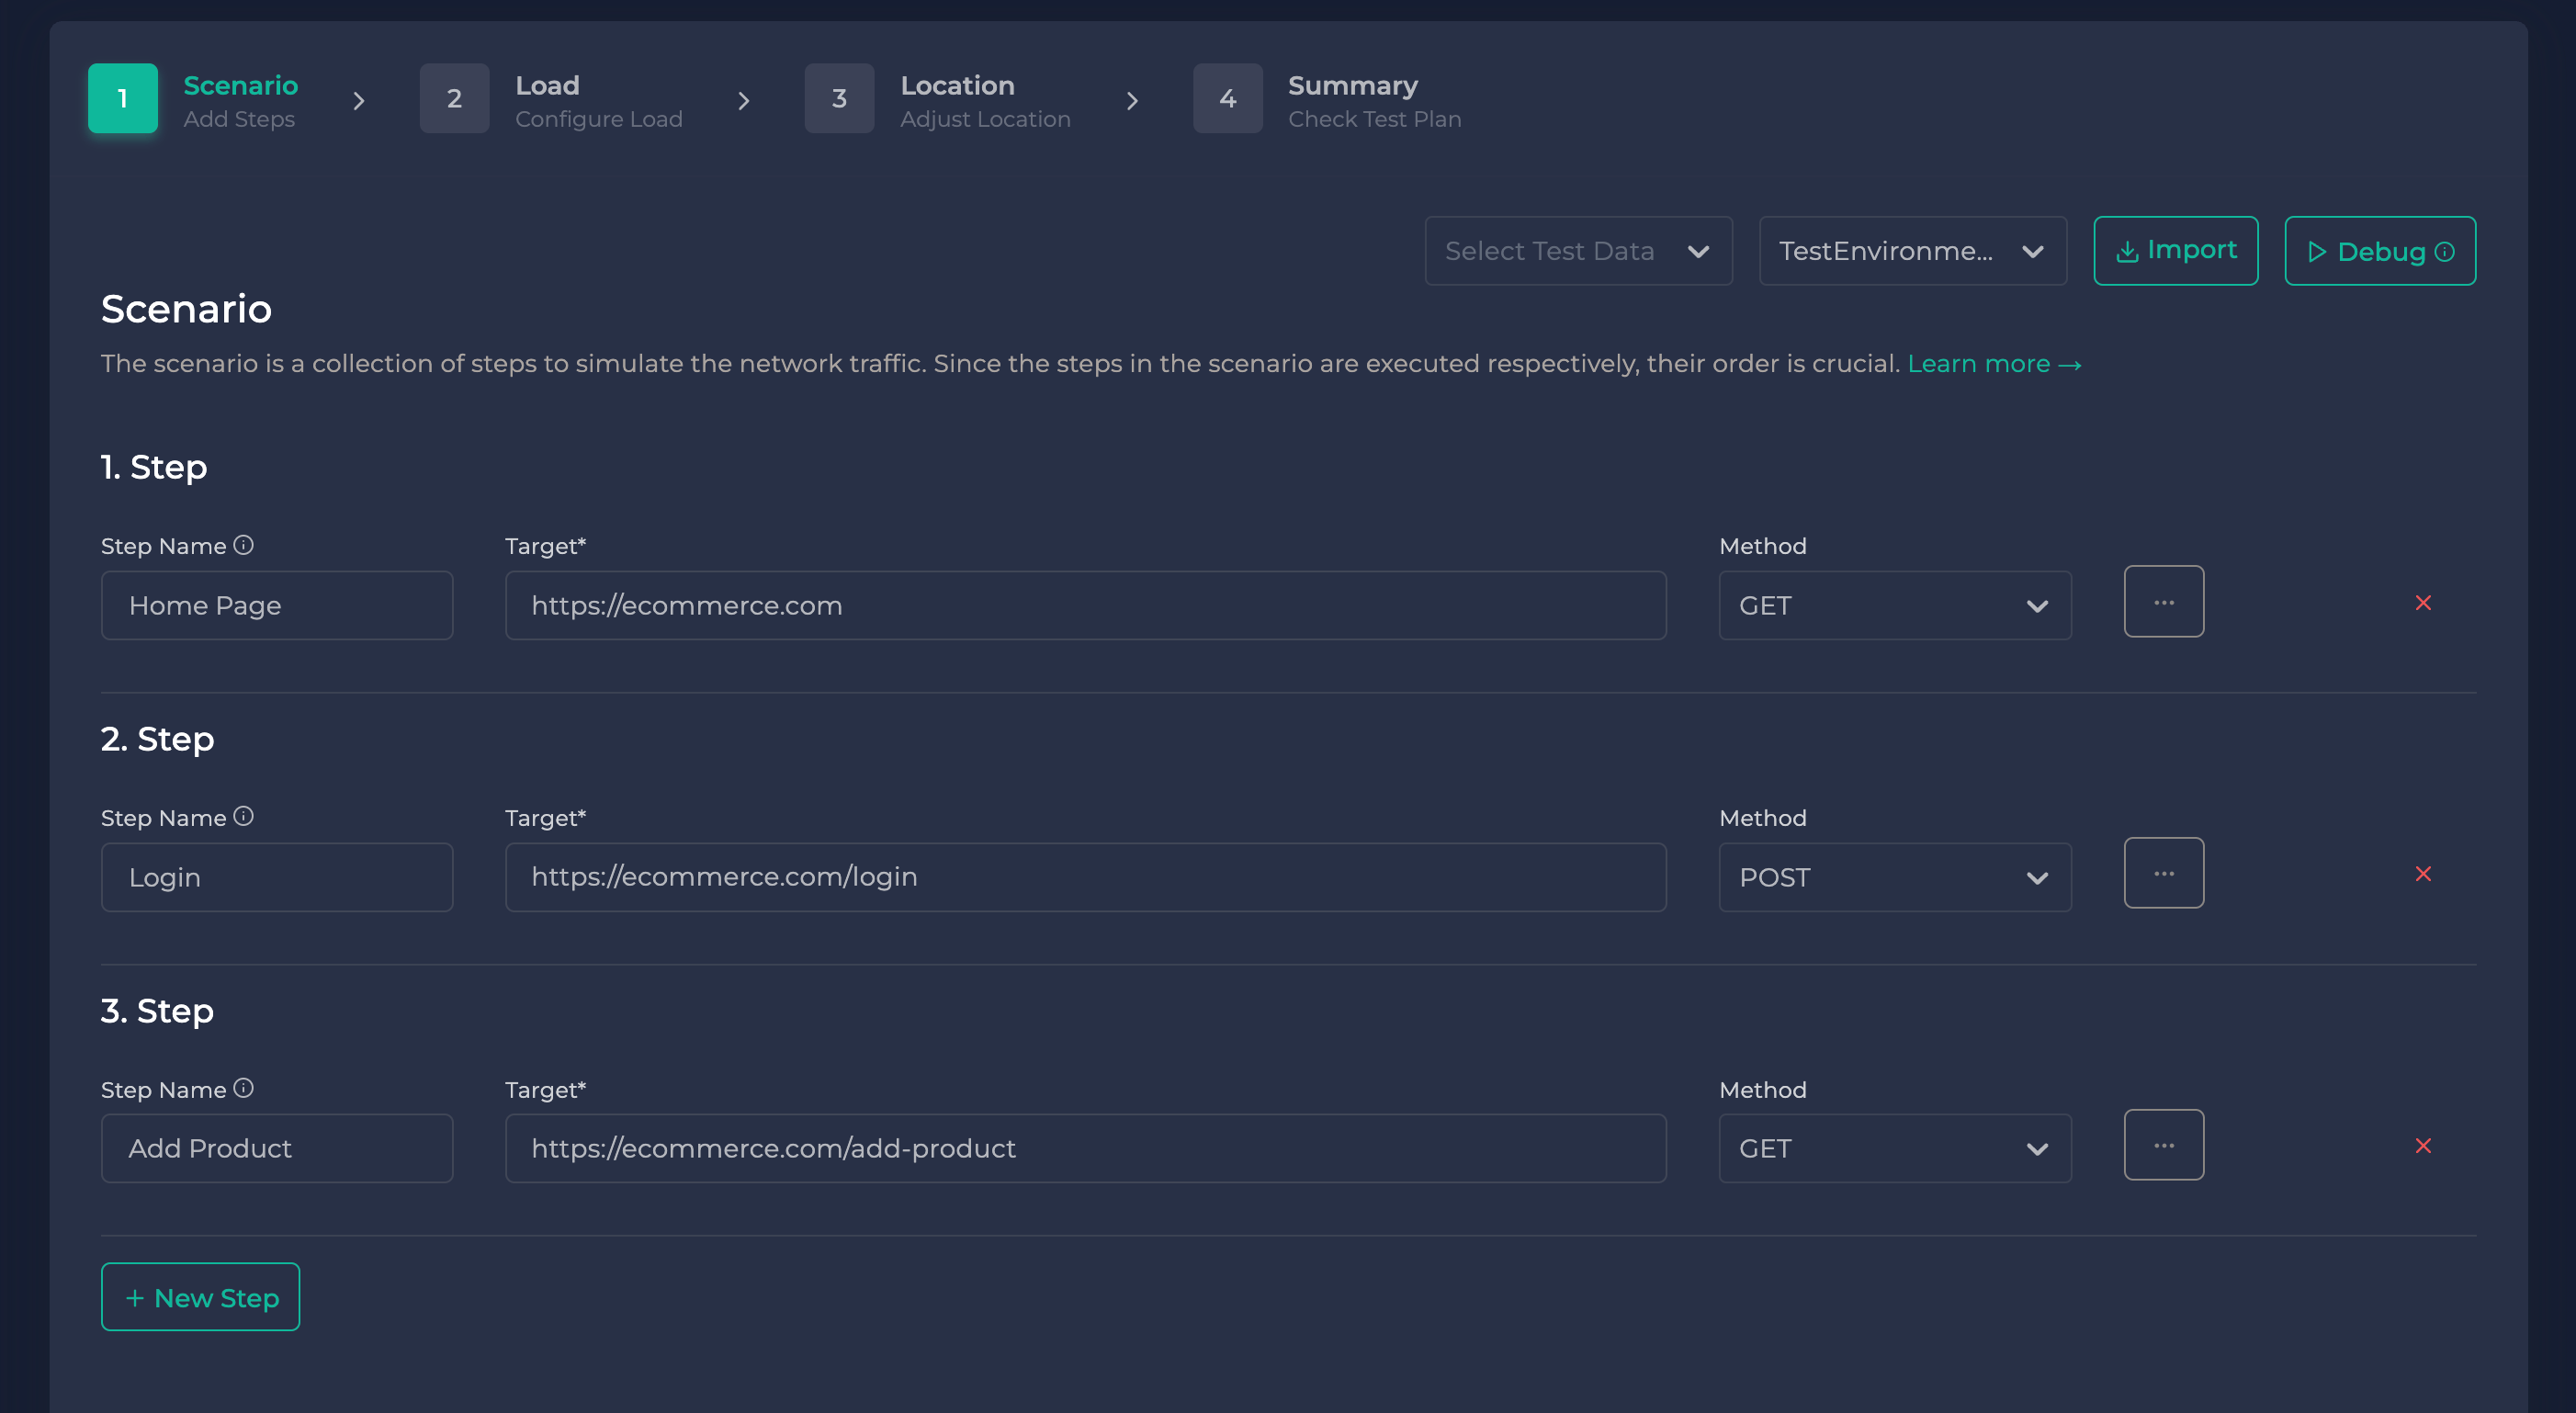
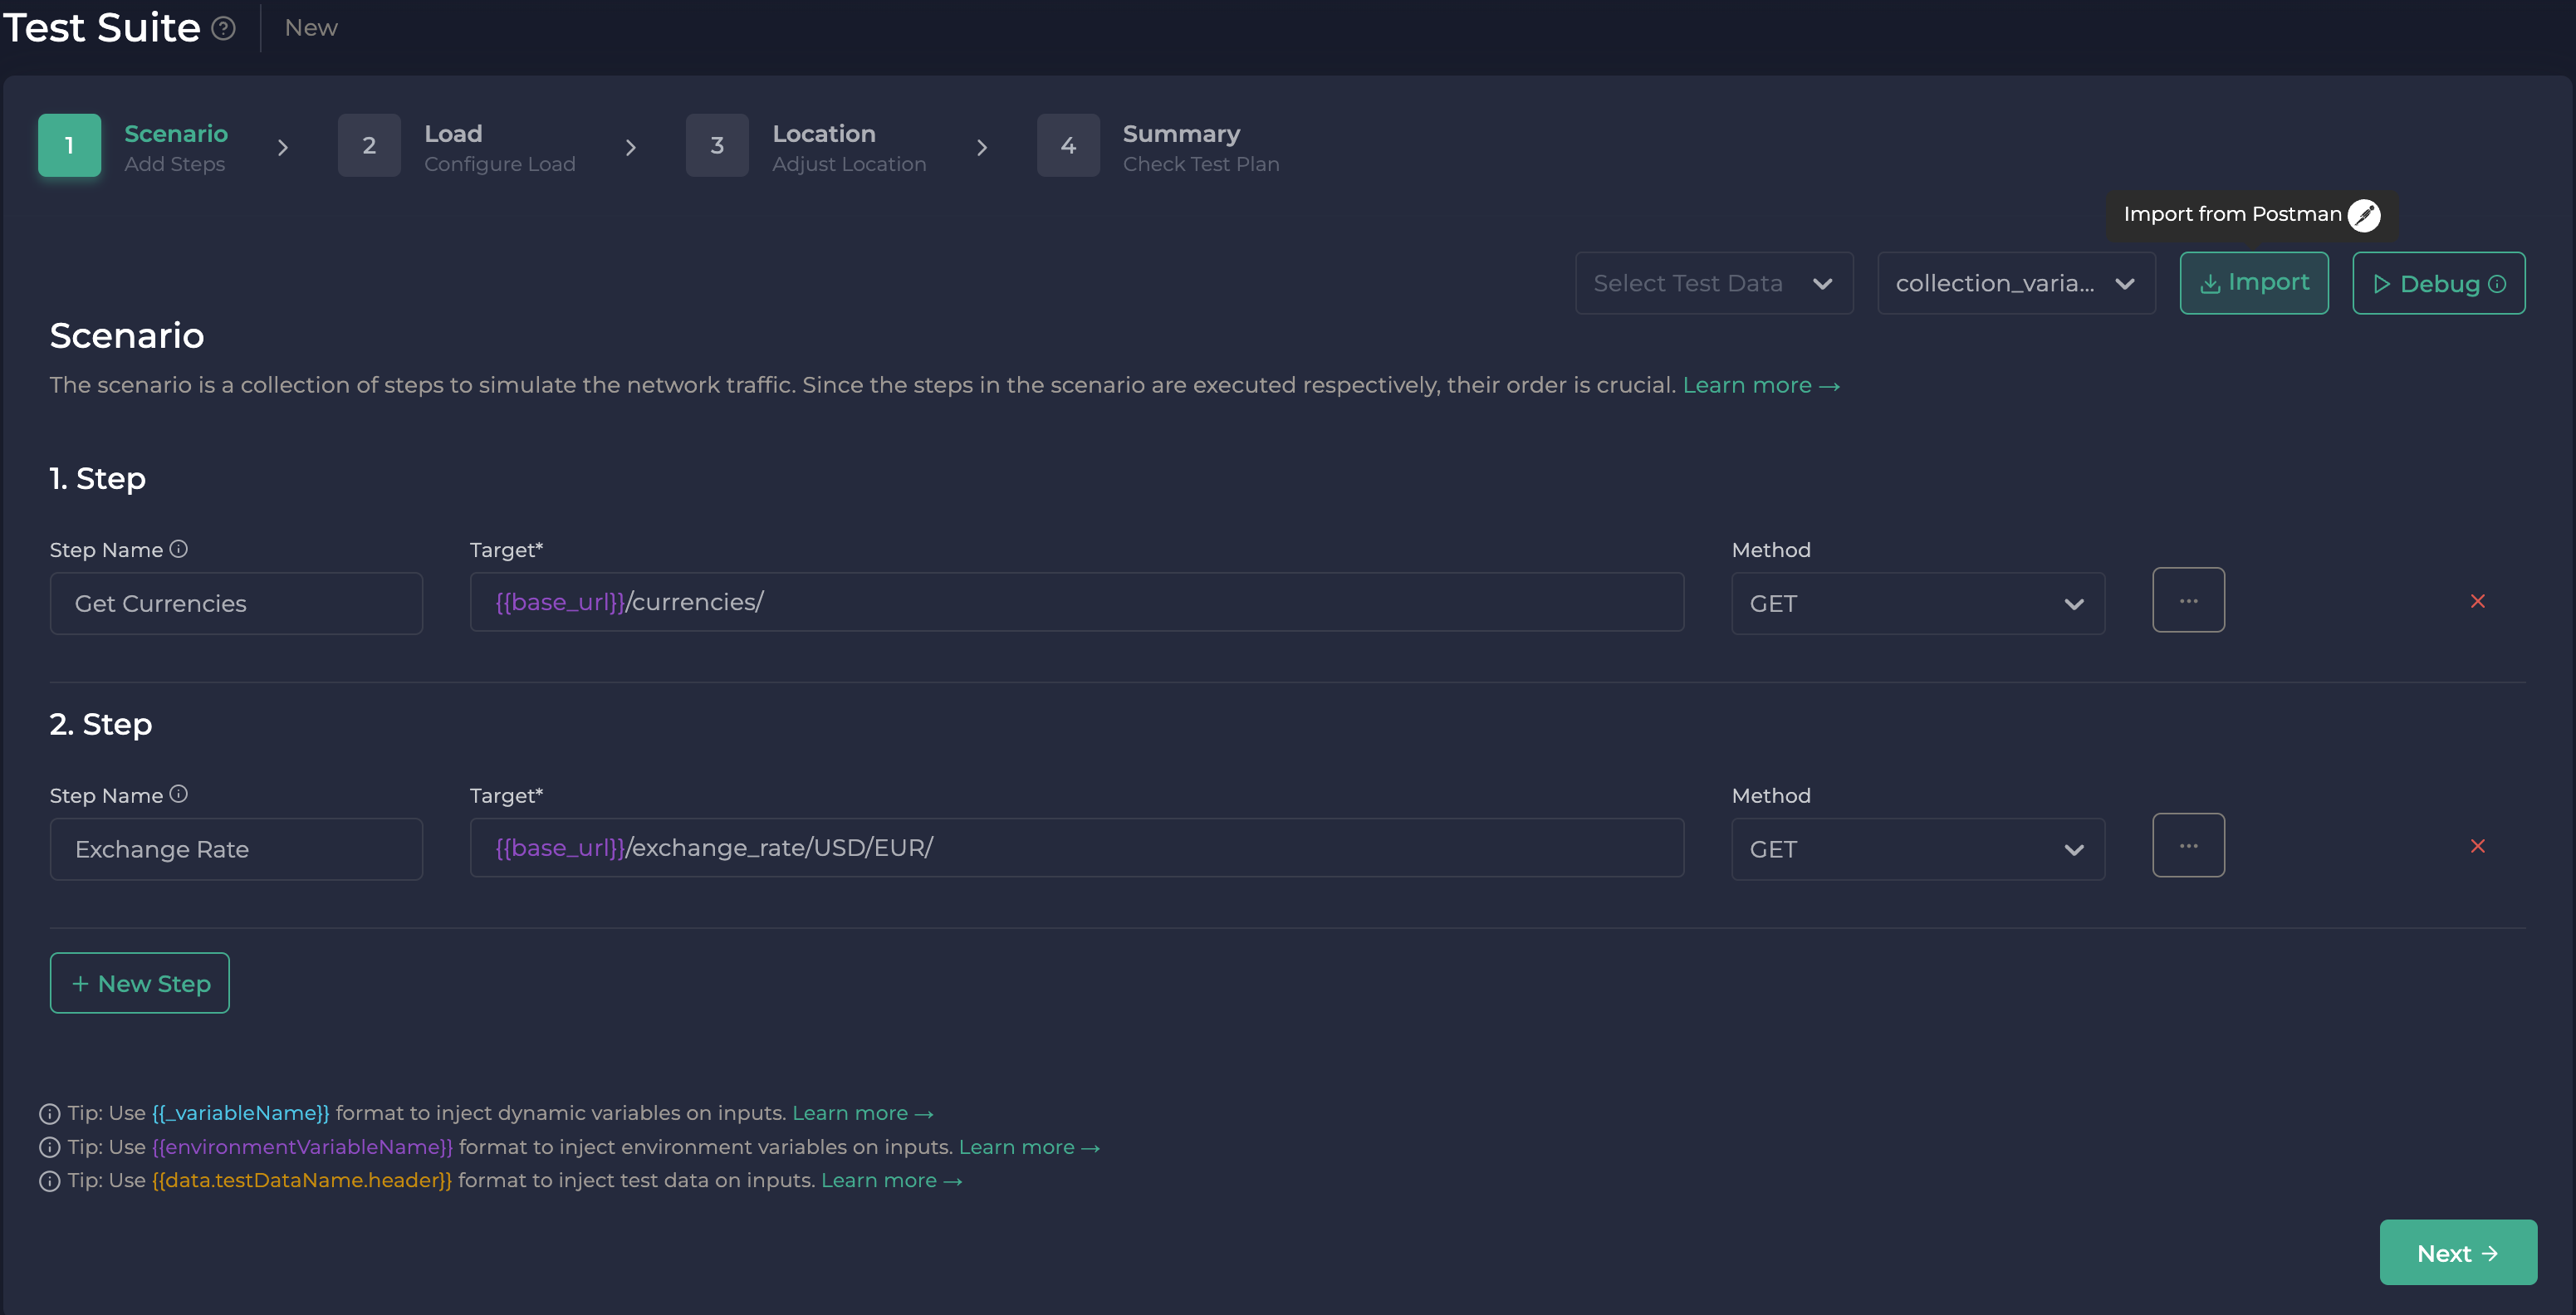
What is a Step?
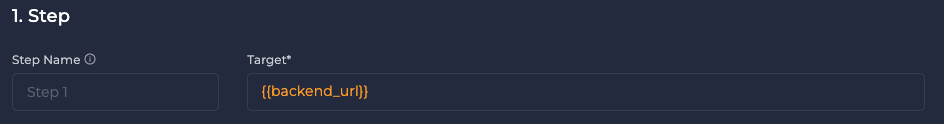
Step represents the individual network request.
Step Nameis not mandatory. But it is nice to have since you can easily distinguish your steps on the Test Report page if you provide it.Targetis where you supply network protocol and URL.Methodis the HTTP method.
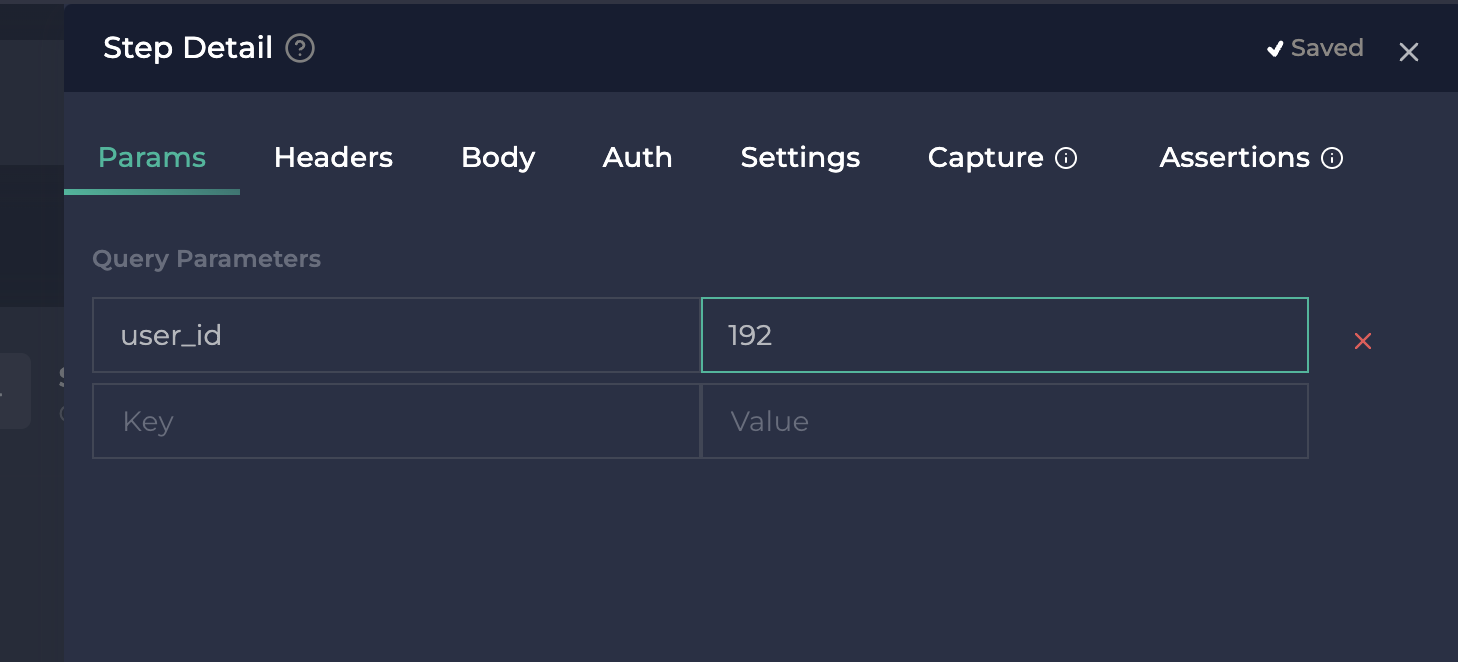
Don't put query parameters in the target field. There is a section for query parameters in the Step Details section.
For example, instead of http://example.com/search?q=term write http://example.com/search and put q=term parameter to the key-value form in Step Details modal.
- Click the
New Stepbutton if you would like to add another step to the scenario. - Click the 'More' (three-dot icon at the right) button to provide Step Details.
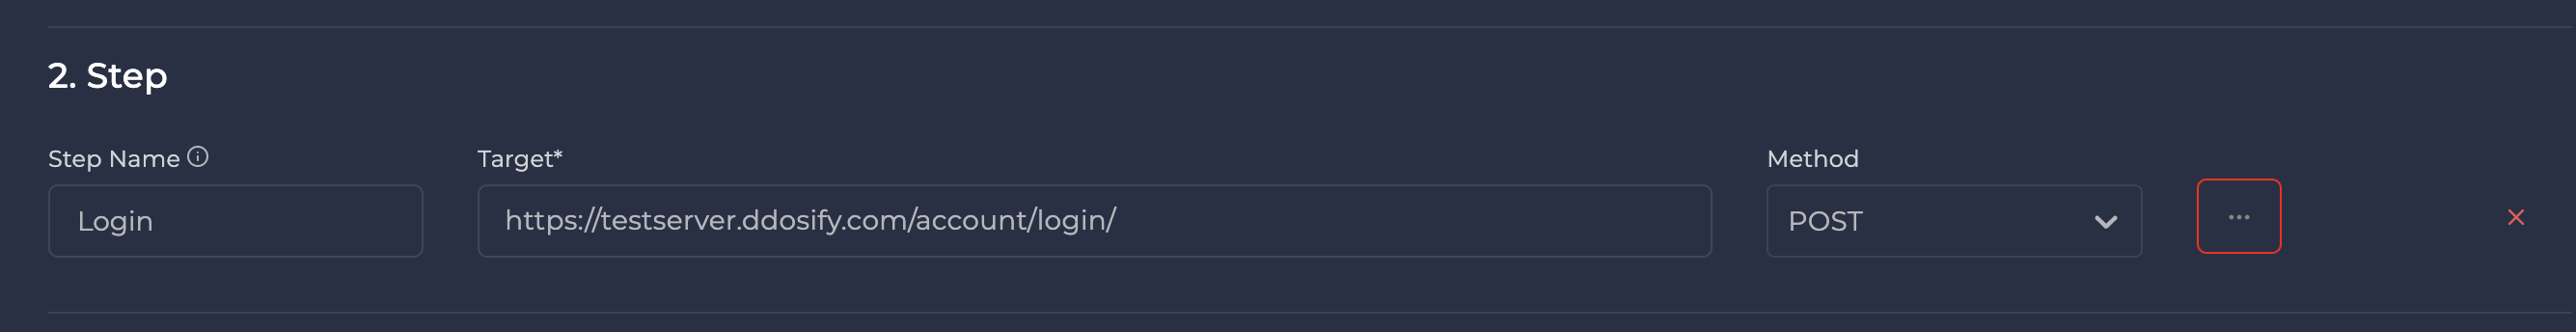
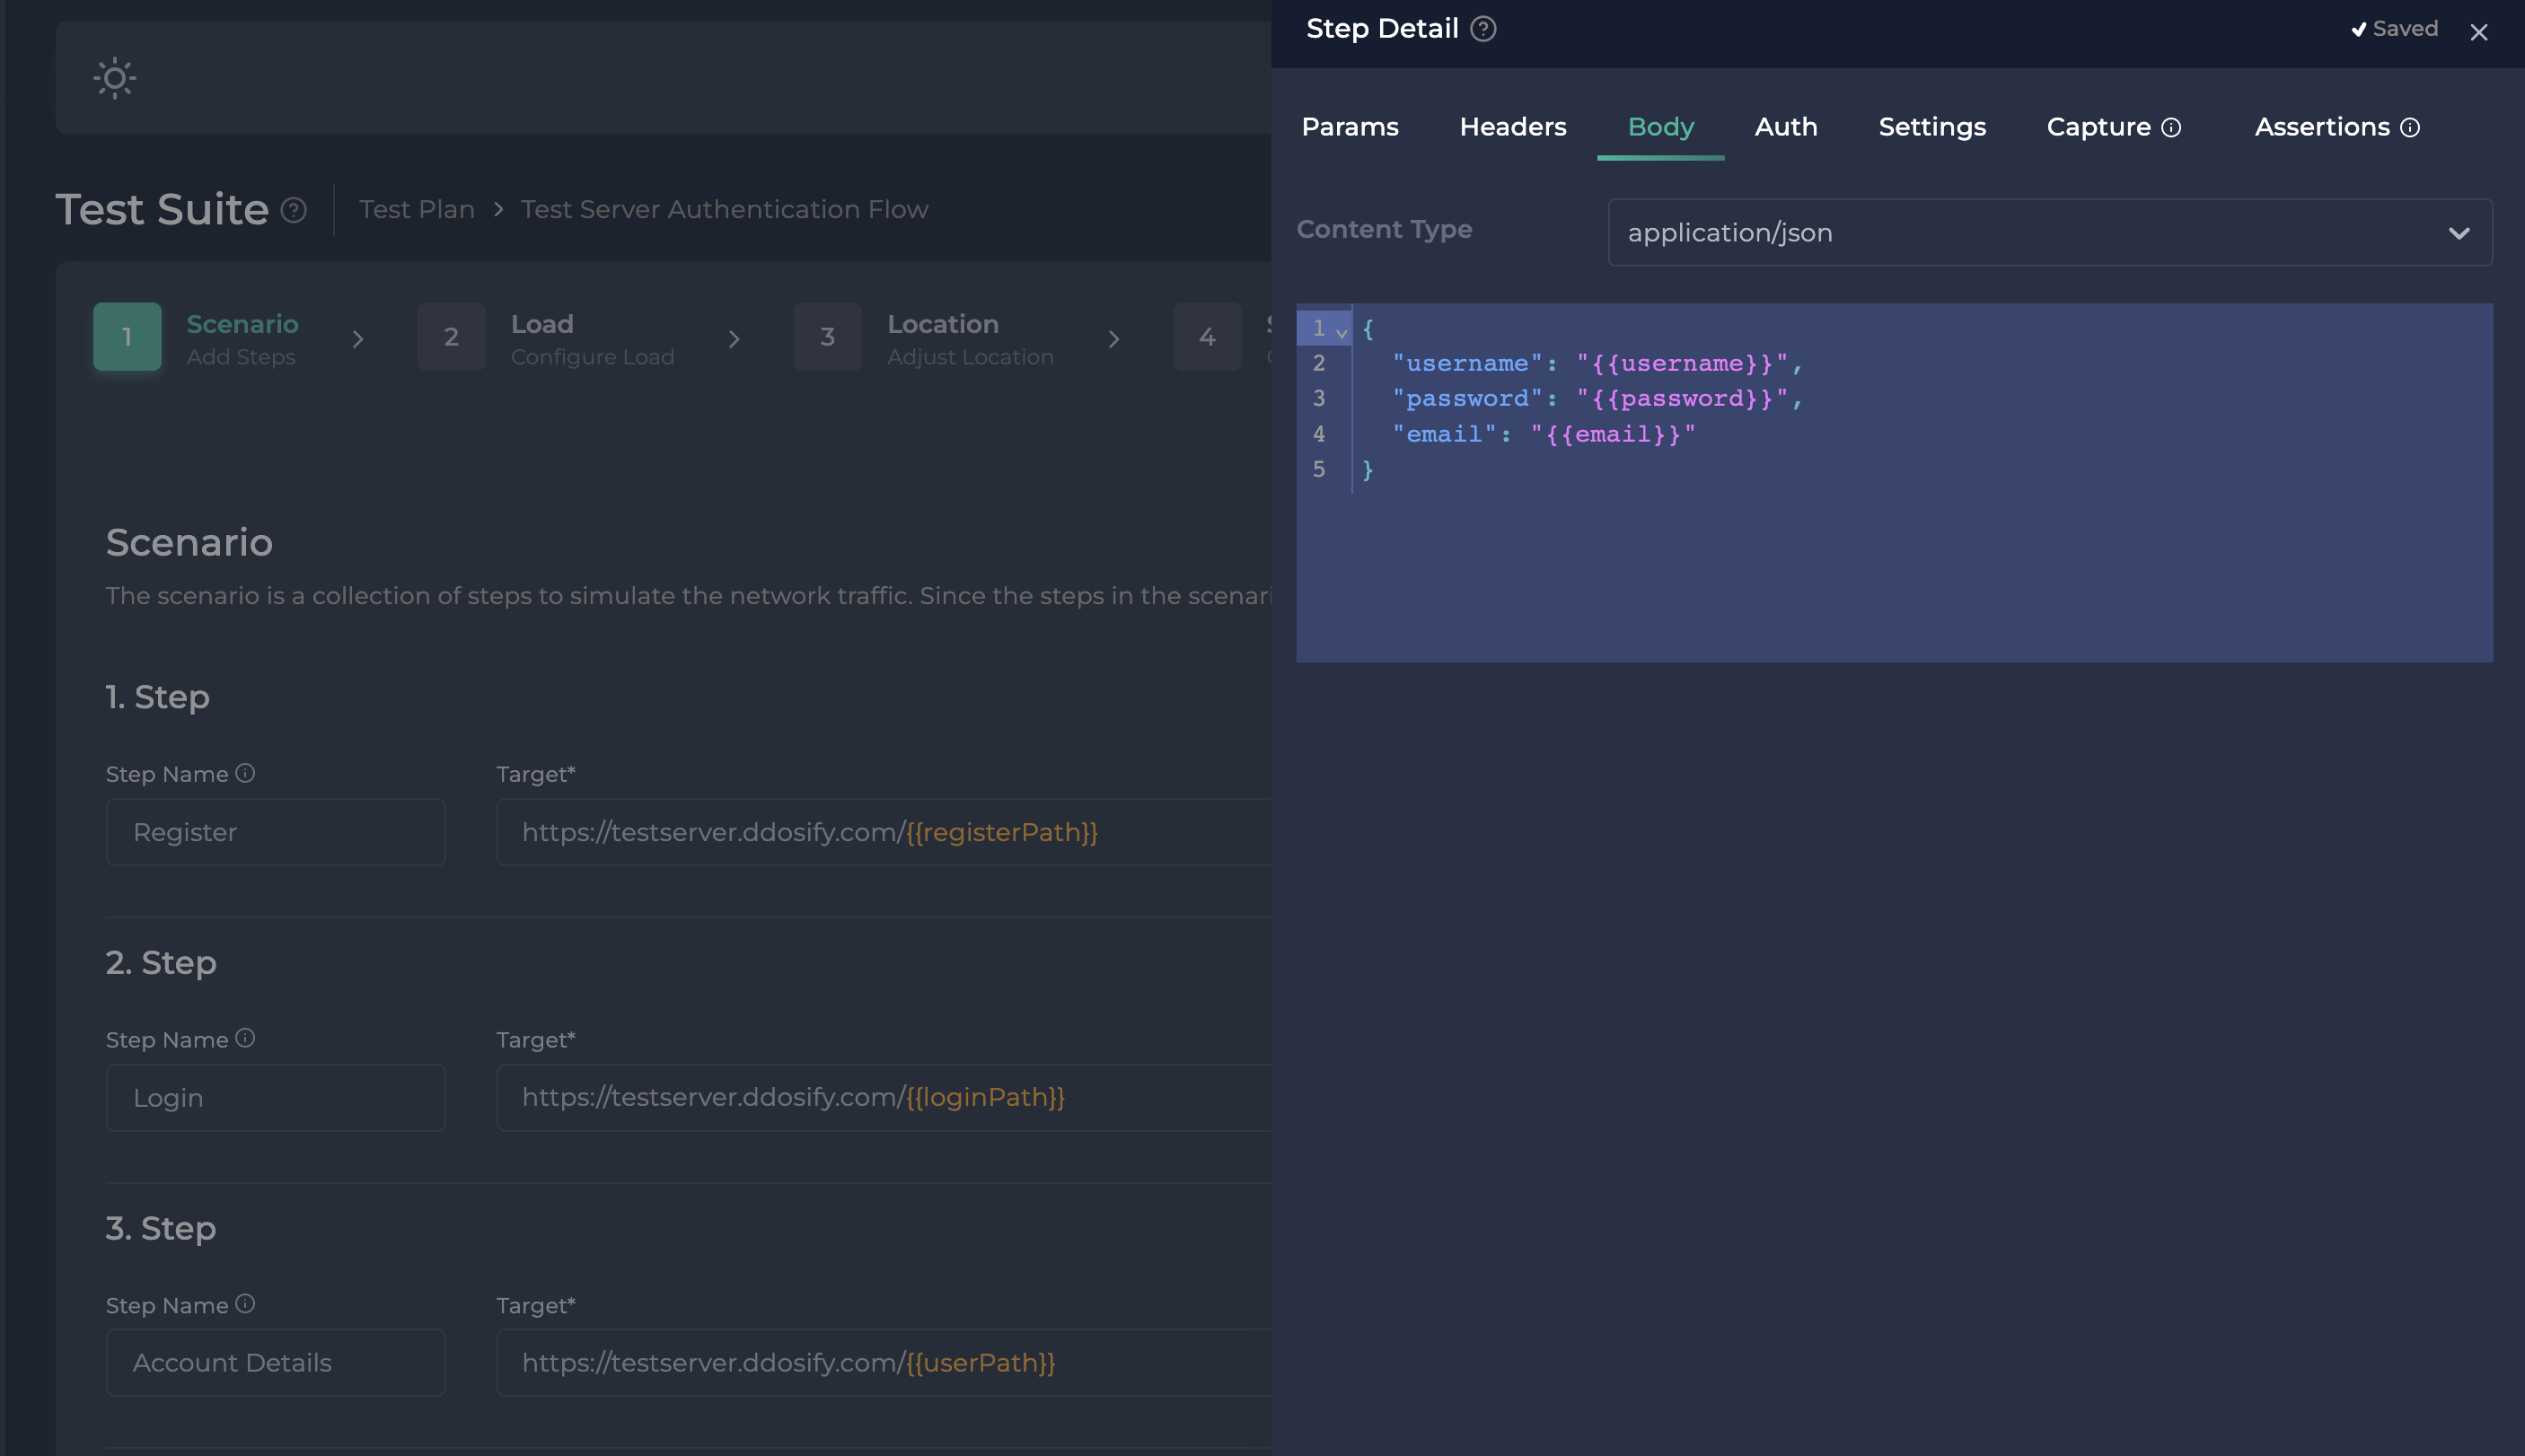
Step Details
You can provide query parameters, request headers, payload, authentication, and network details of the request here. You can also Capture Variables and create Assertion logic in Step Detail.
Load Configuration
Once you configured your scenario, the next step is configuring the shape and duration of the load.
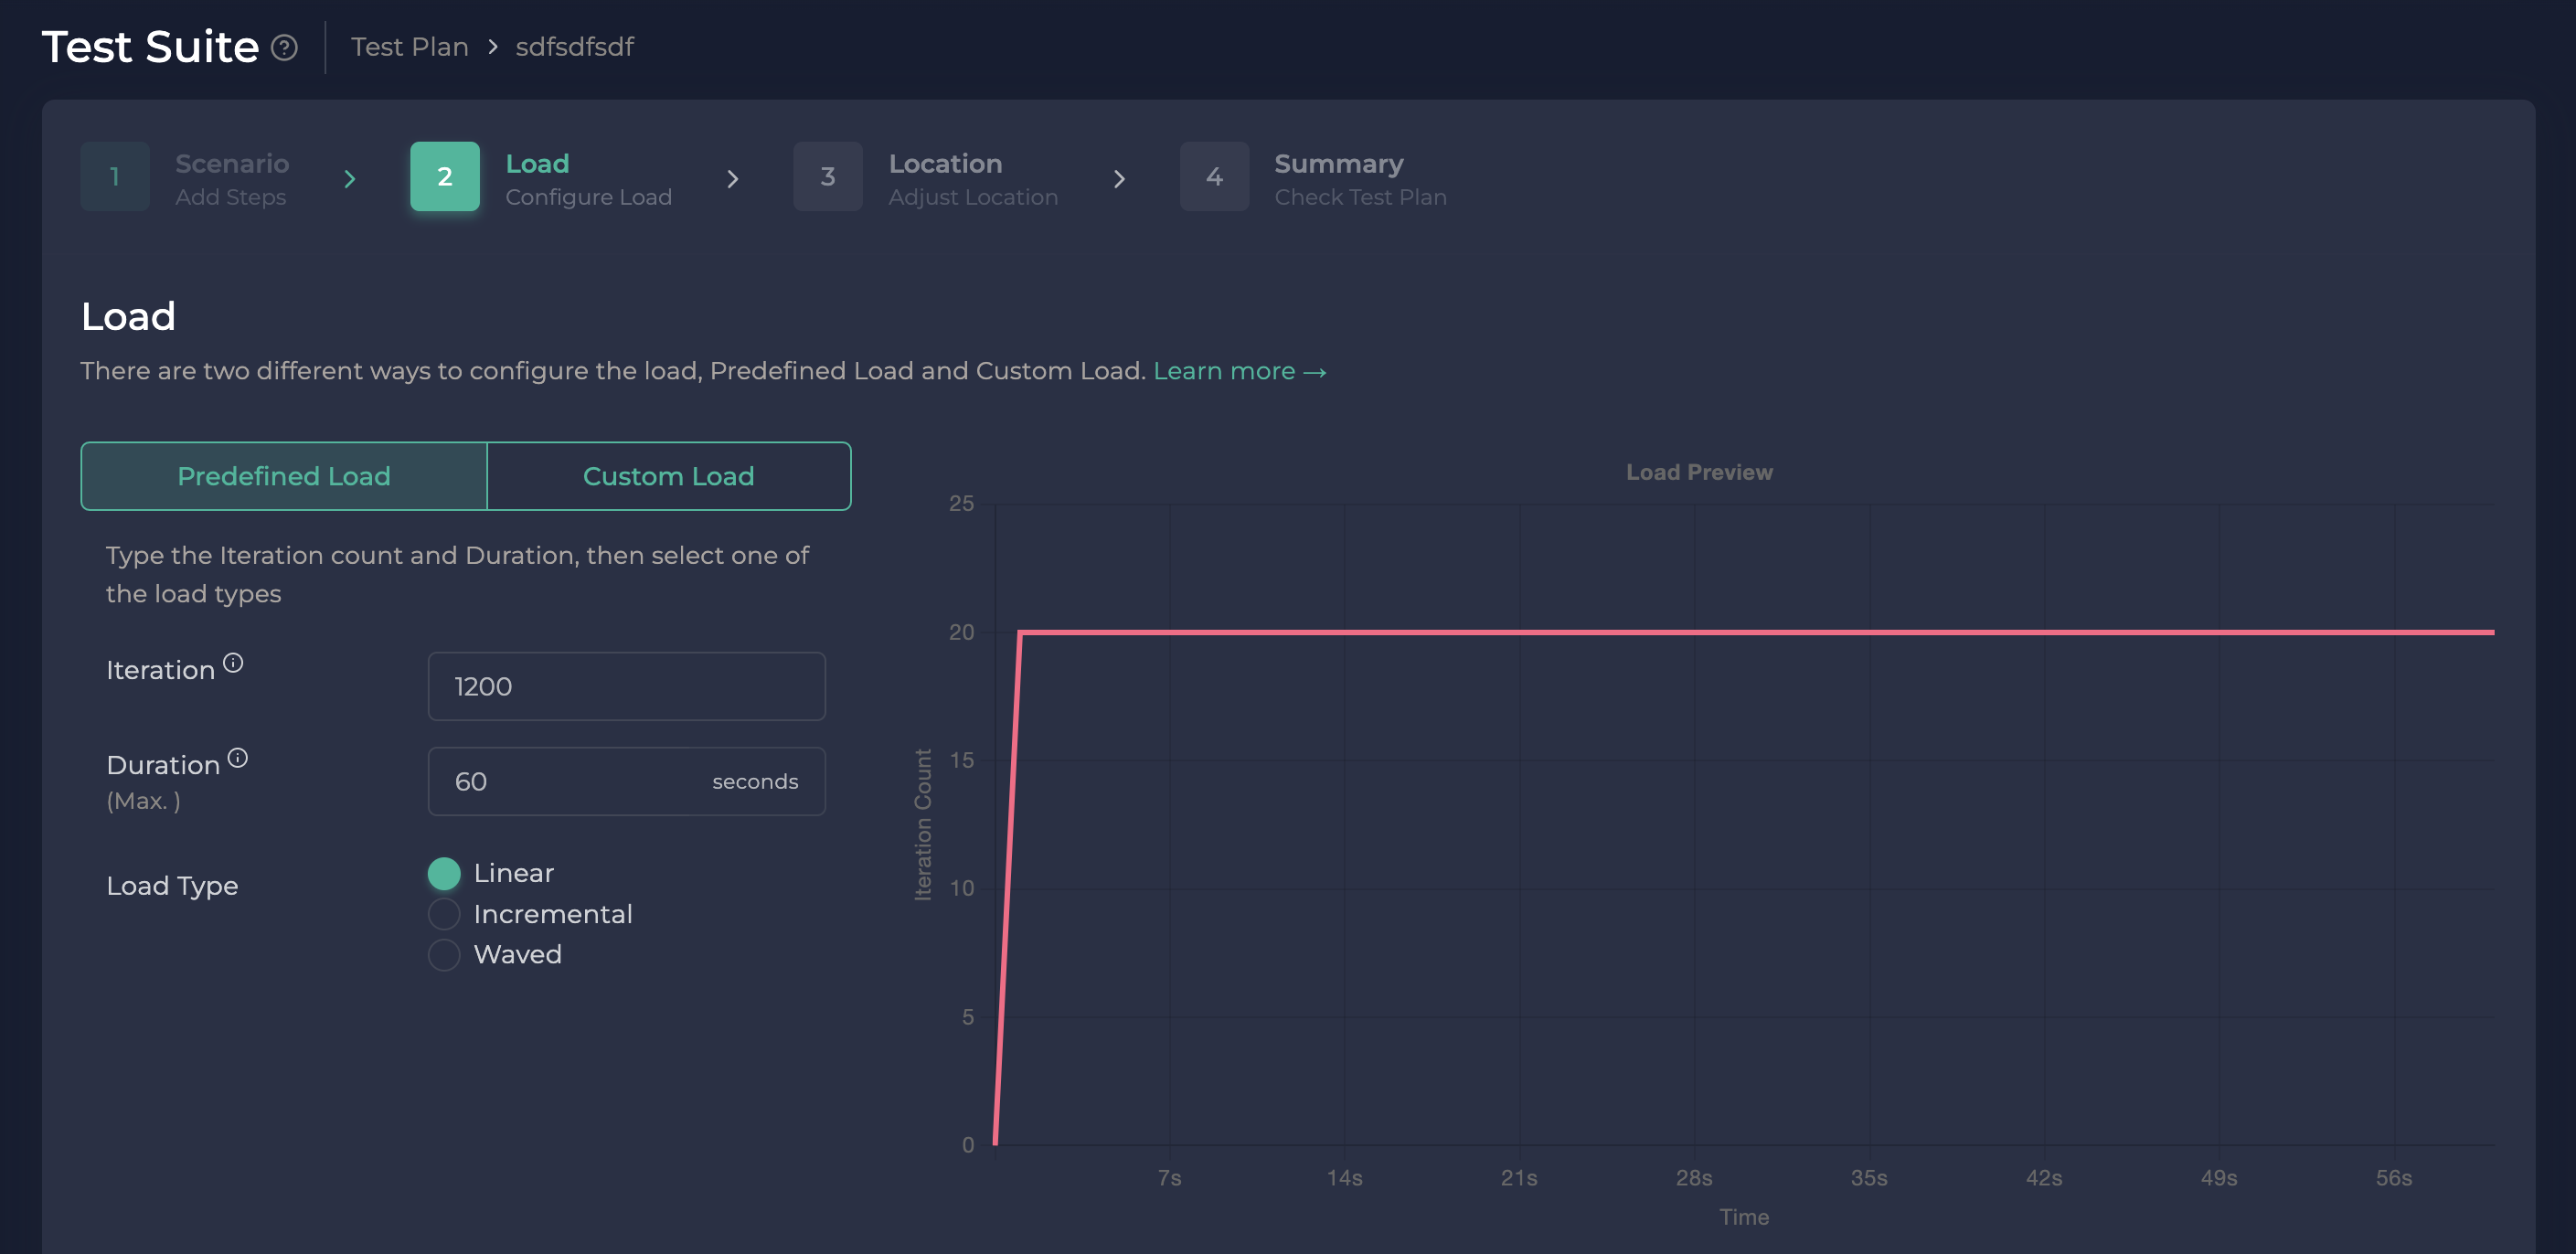
There are two methods for configuring the load: Predefined Load and Custom Load. However, both methods share two common elements: the total iteration count and the total test duration. Let's familiarize ourselves with these elements first.
Iteration Count
The Scenario is composed of a series of Steps that are executed in order. The term "iteration count" refers to the number of times the entire Scenario is executed. While some might call this the run or transaction count, we prefer to use "iteration count."
It's important to clarify that the iteration count is distinct from the request count. The relationship between these two depends on the number of Steps in the Scenario. For instance, if a Scenario contains three Steps and has an iteration count of 100, the total request count would be 300 (100 iterations multiplied by 3 Steps).
Duration
The Duration simply indicates the total length of the test in seconds, without any hidden significance.
Good to know: You can see the maximum test duration you can supply at the bottom of the Duration label.
Predefined Load
The predefined load is designed to save you time on setup. Simply input the Iteration count and Duration, then choose one of the load types. That's all it takes. Ddosify offers 3 unique load types for various scenarios:
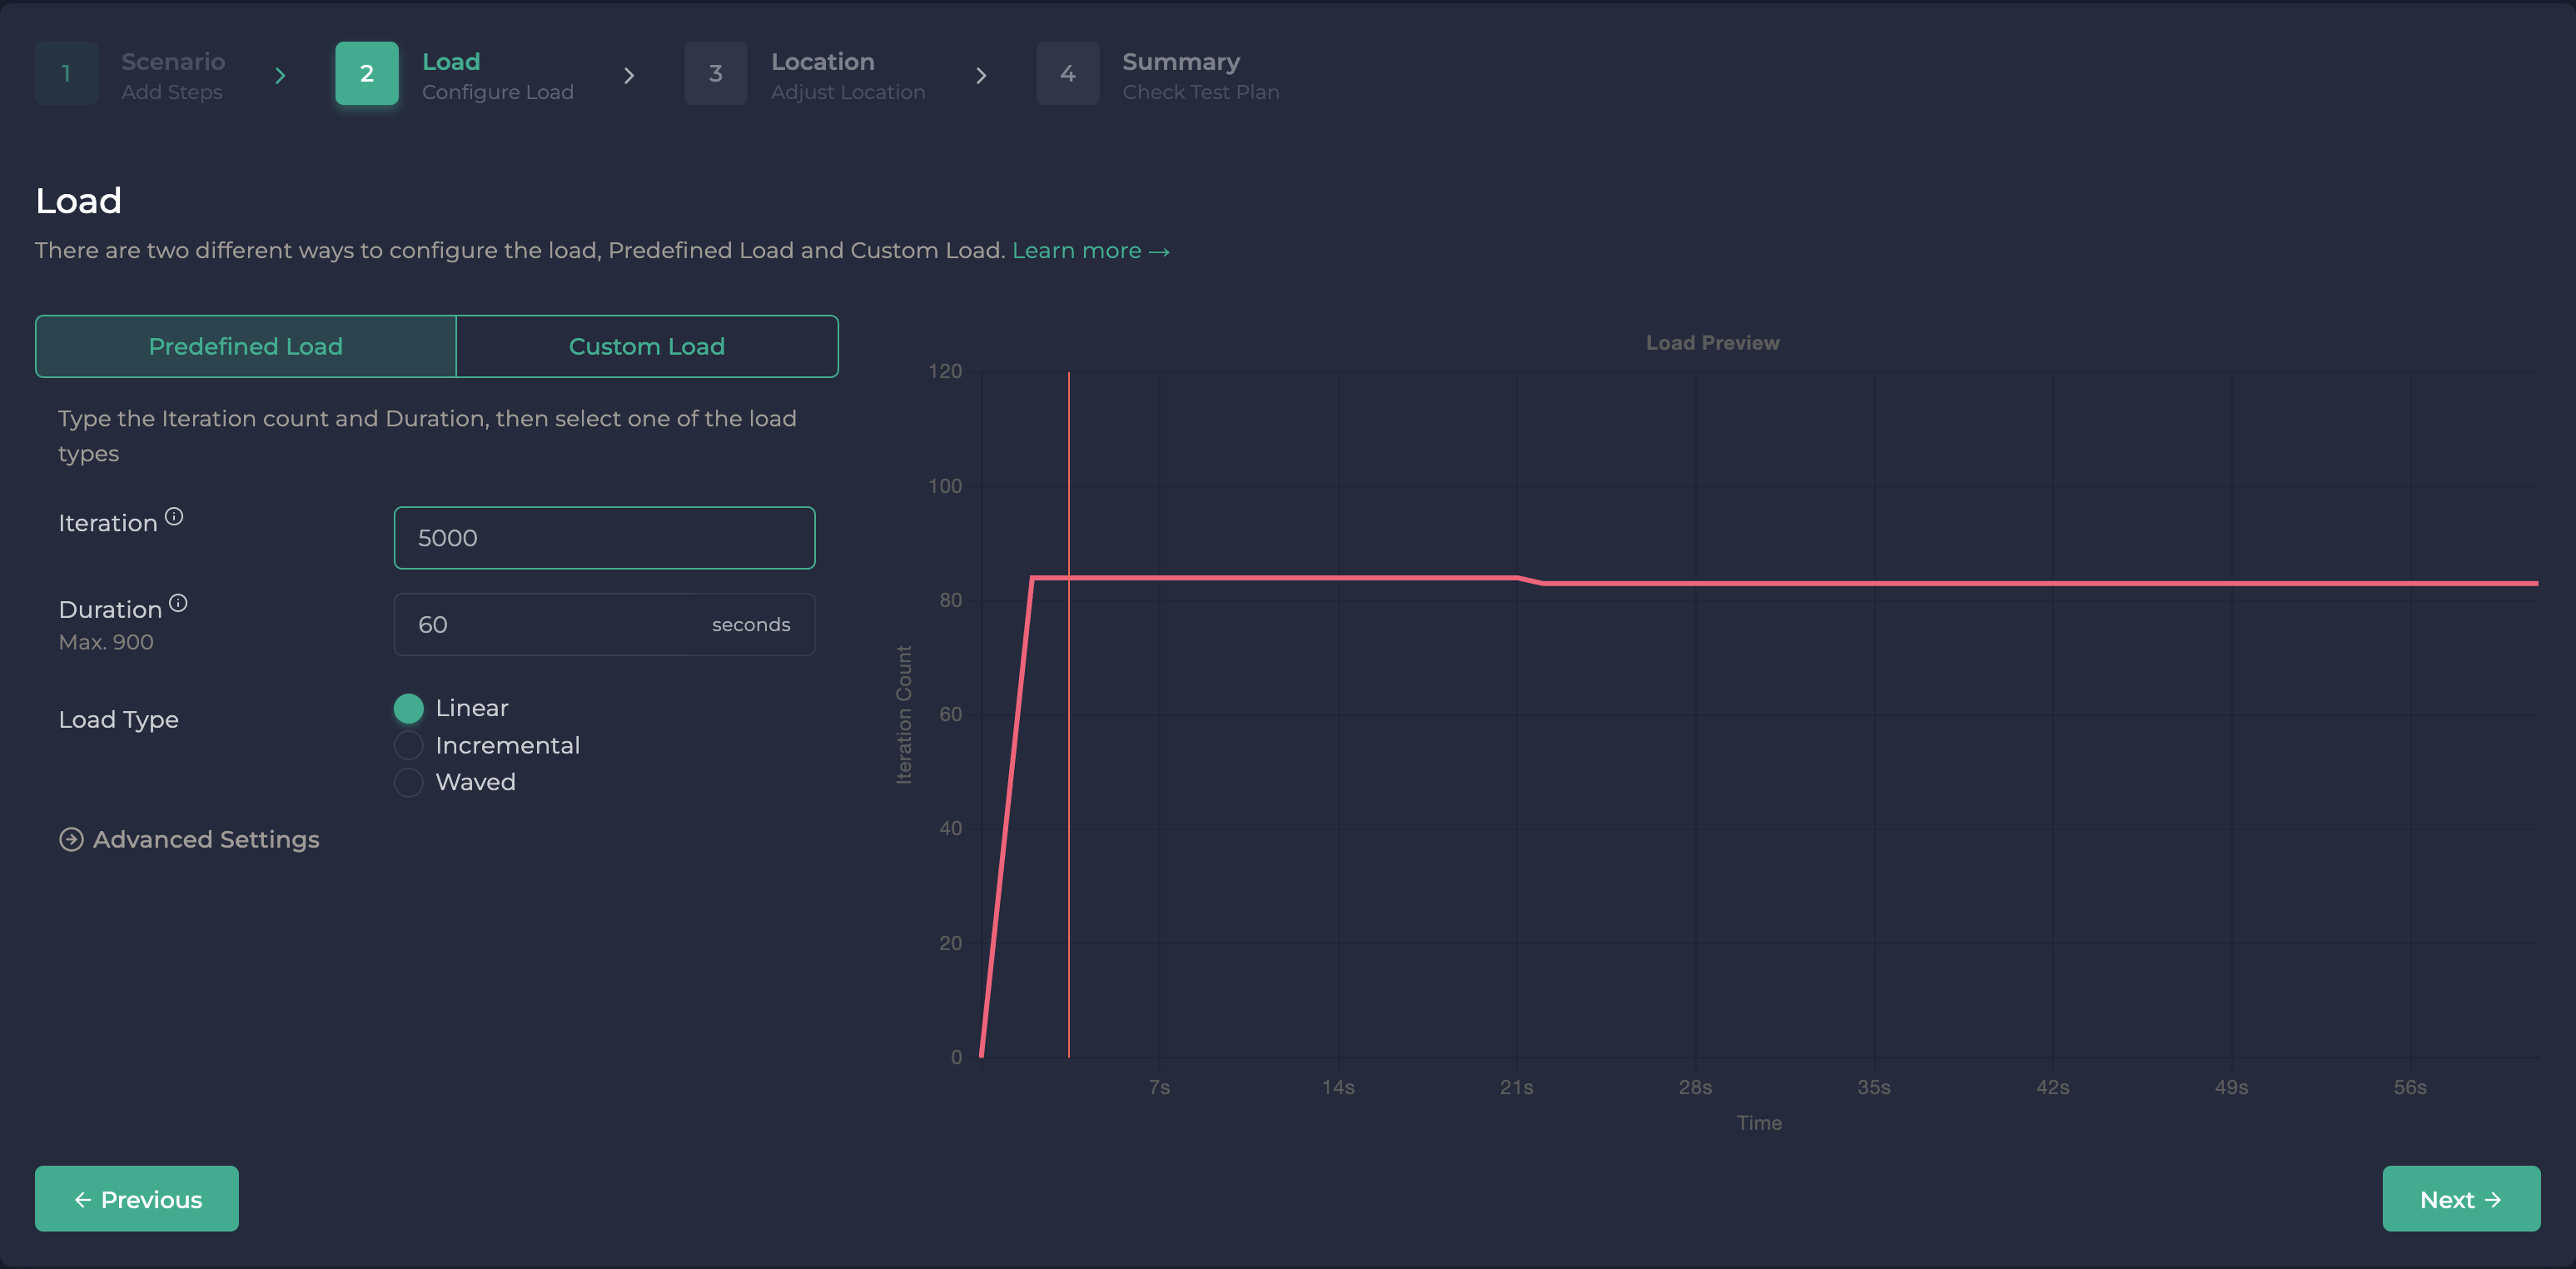
Linear Load
With a linear load, the iteration count remains constant every second. For example, if the iteration count is 100 and Duration is 10 seconds, Ddosify will execute 10 iterations per second.
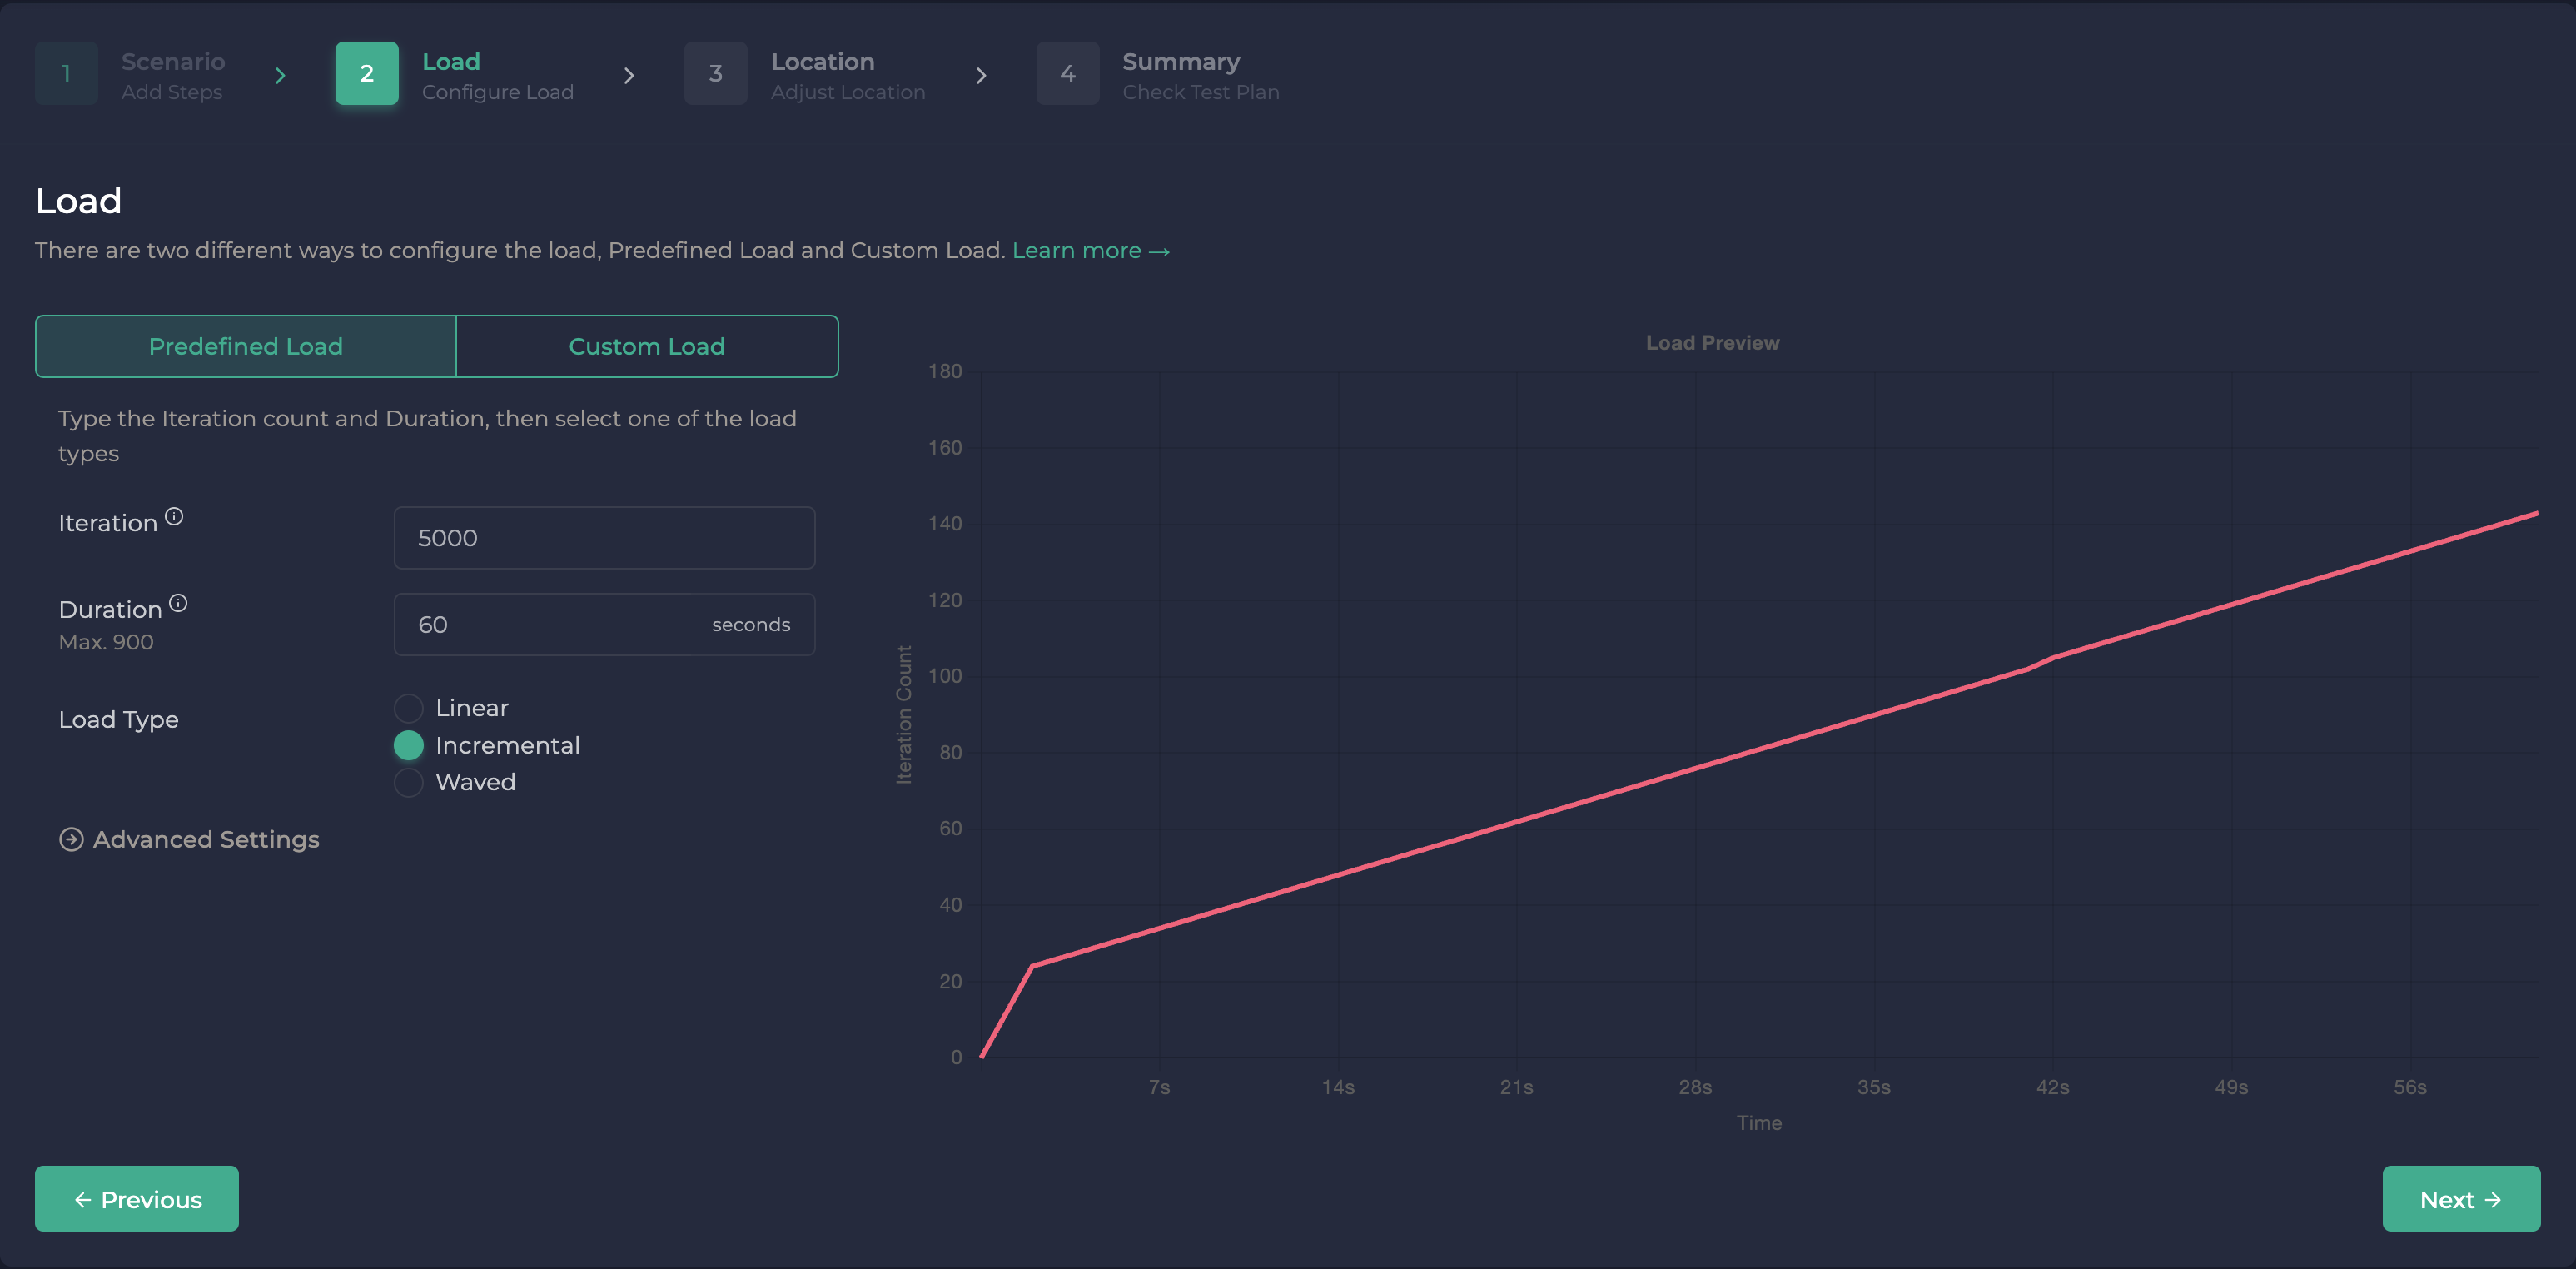
Incremental Load
In contrast to the linear load, the iteration count increases each second in this load type.
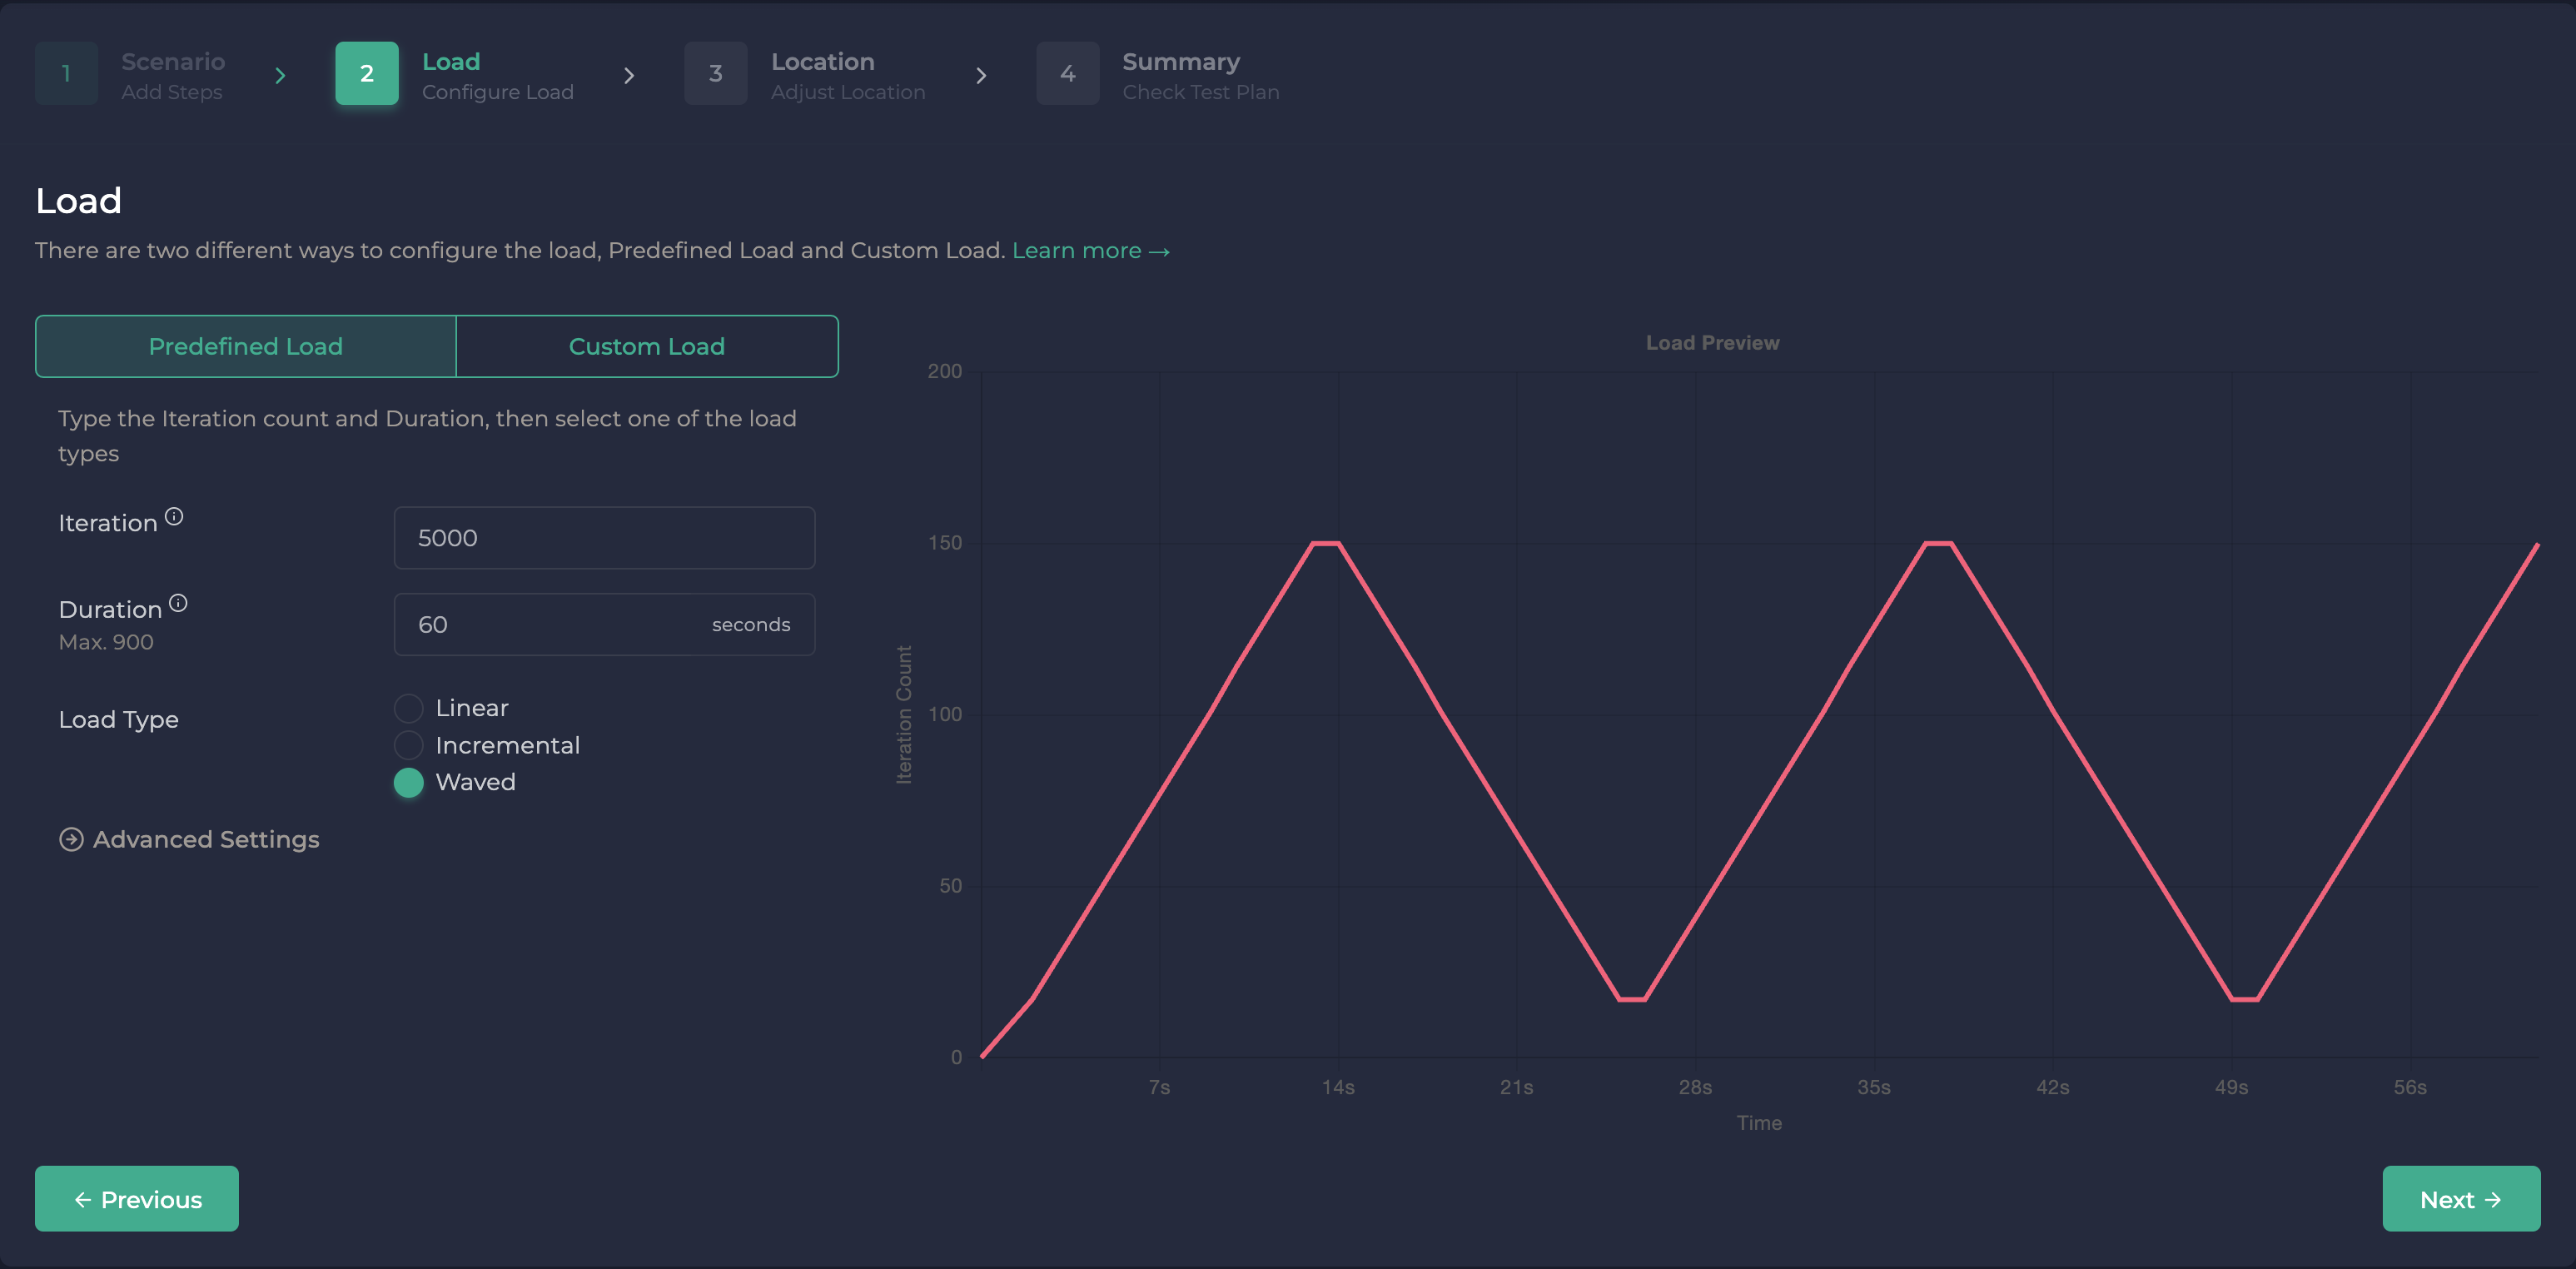
Waved Load
Real-life traffic doesn't follow a consistent pattern, with both busy and quiet periods. To replicate this type of load, Ddosify provides the waved load option.
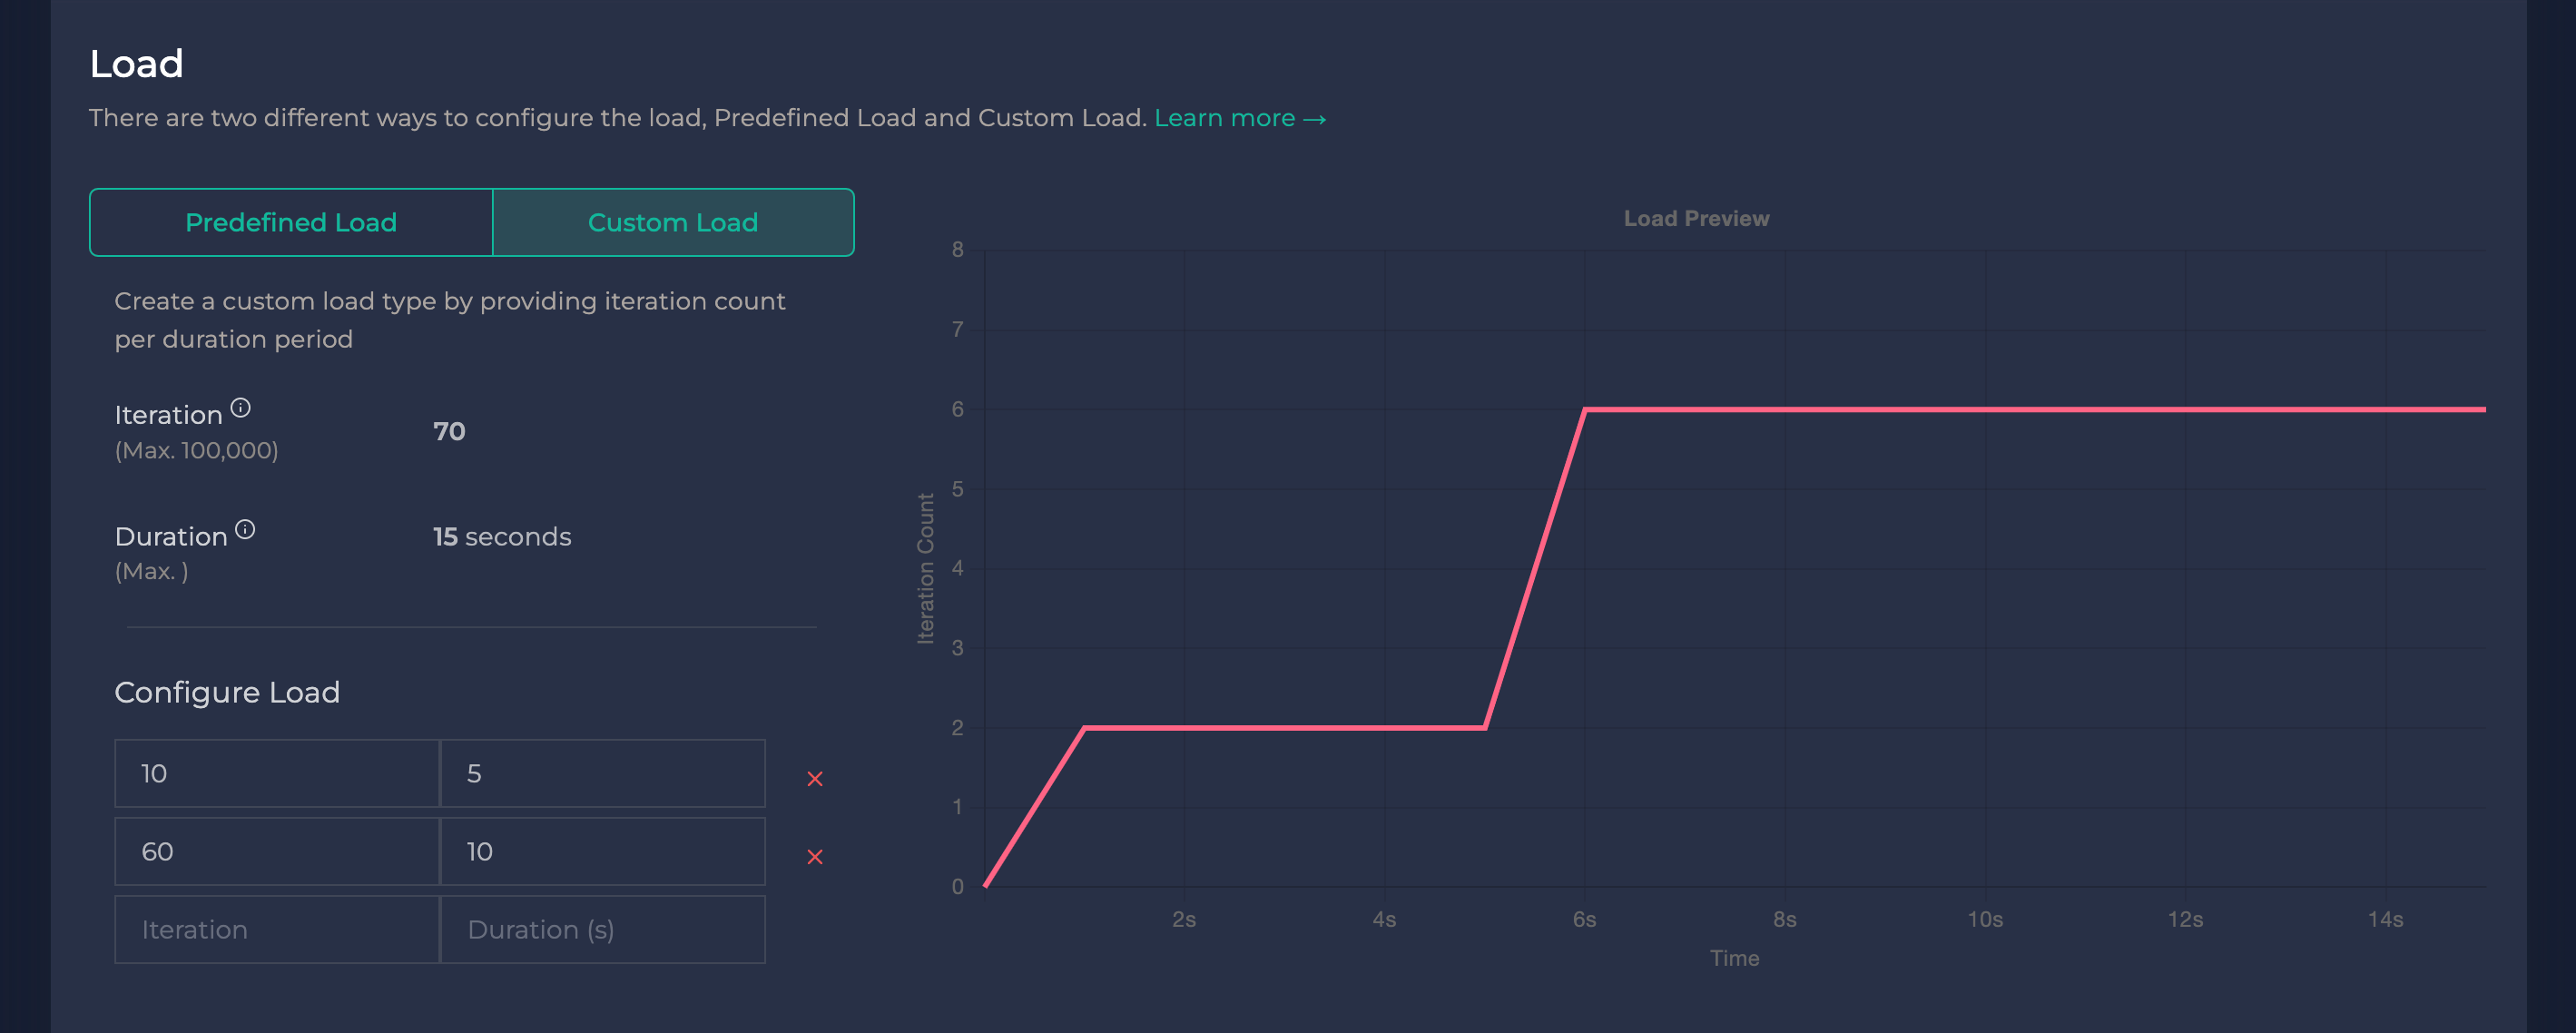
Custom Load
Ddosify comes with pre-defined load types for convenience, but you might want to design your own load type. Using the Custom Load Type Builder, you can set the number of iterations for specific time intervals. To view the load profile you've created, check the Load Preview section, which is situated to the right of the pane.
Location Configuration
In this step, you will configure load volumes from global locations that reflect your user base.
The location module is only available in Ddosify Cloud.
Just like the Load Configuration feature, the Location Configuration offers two methods for geographically distributing the load you set up earlier.
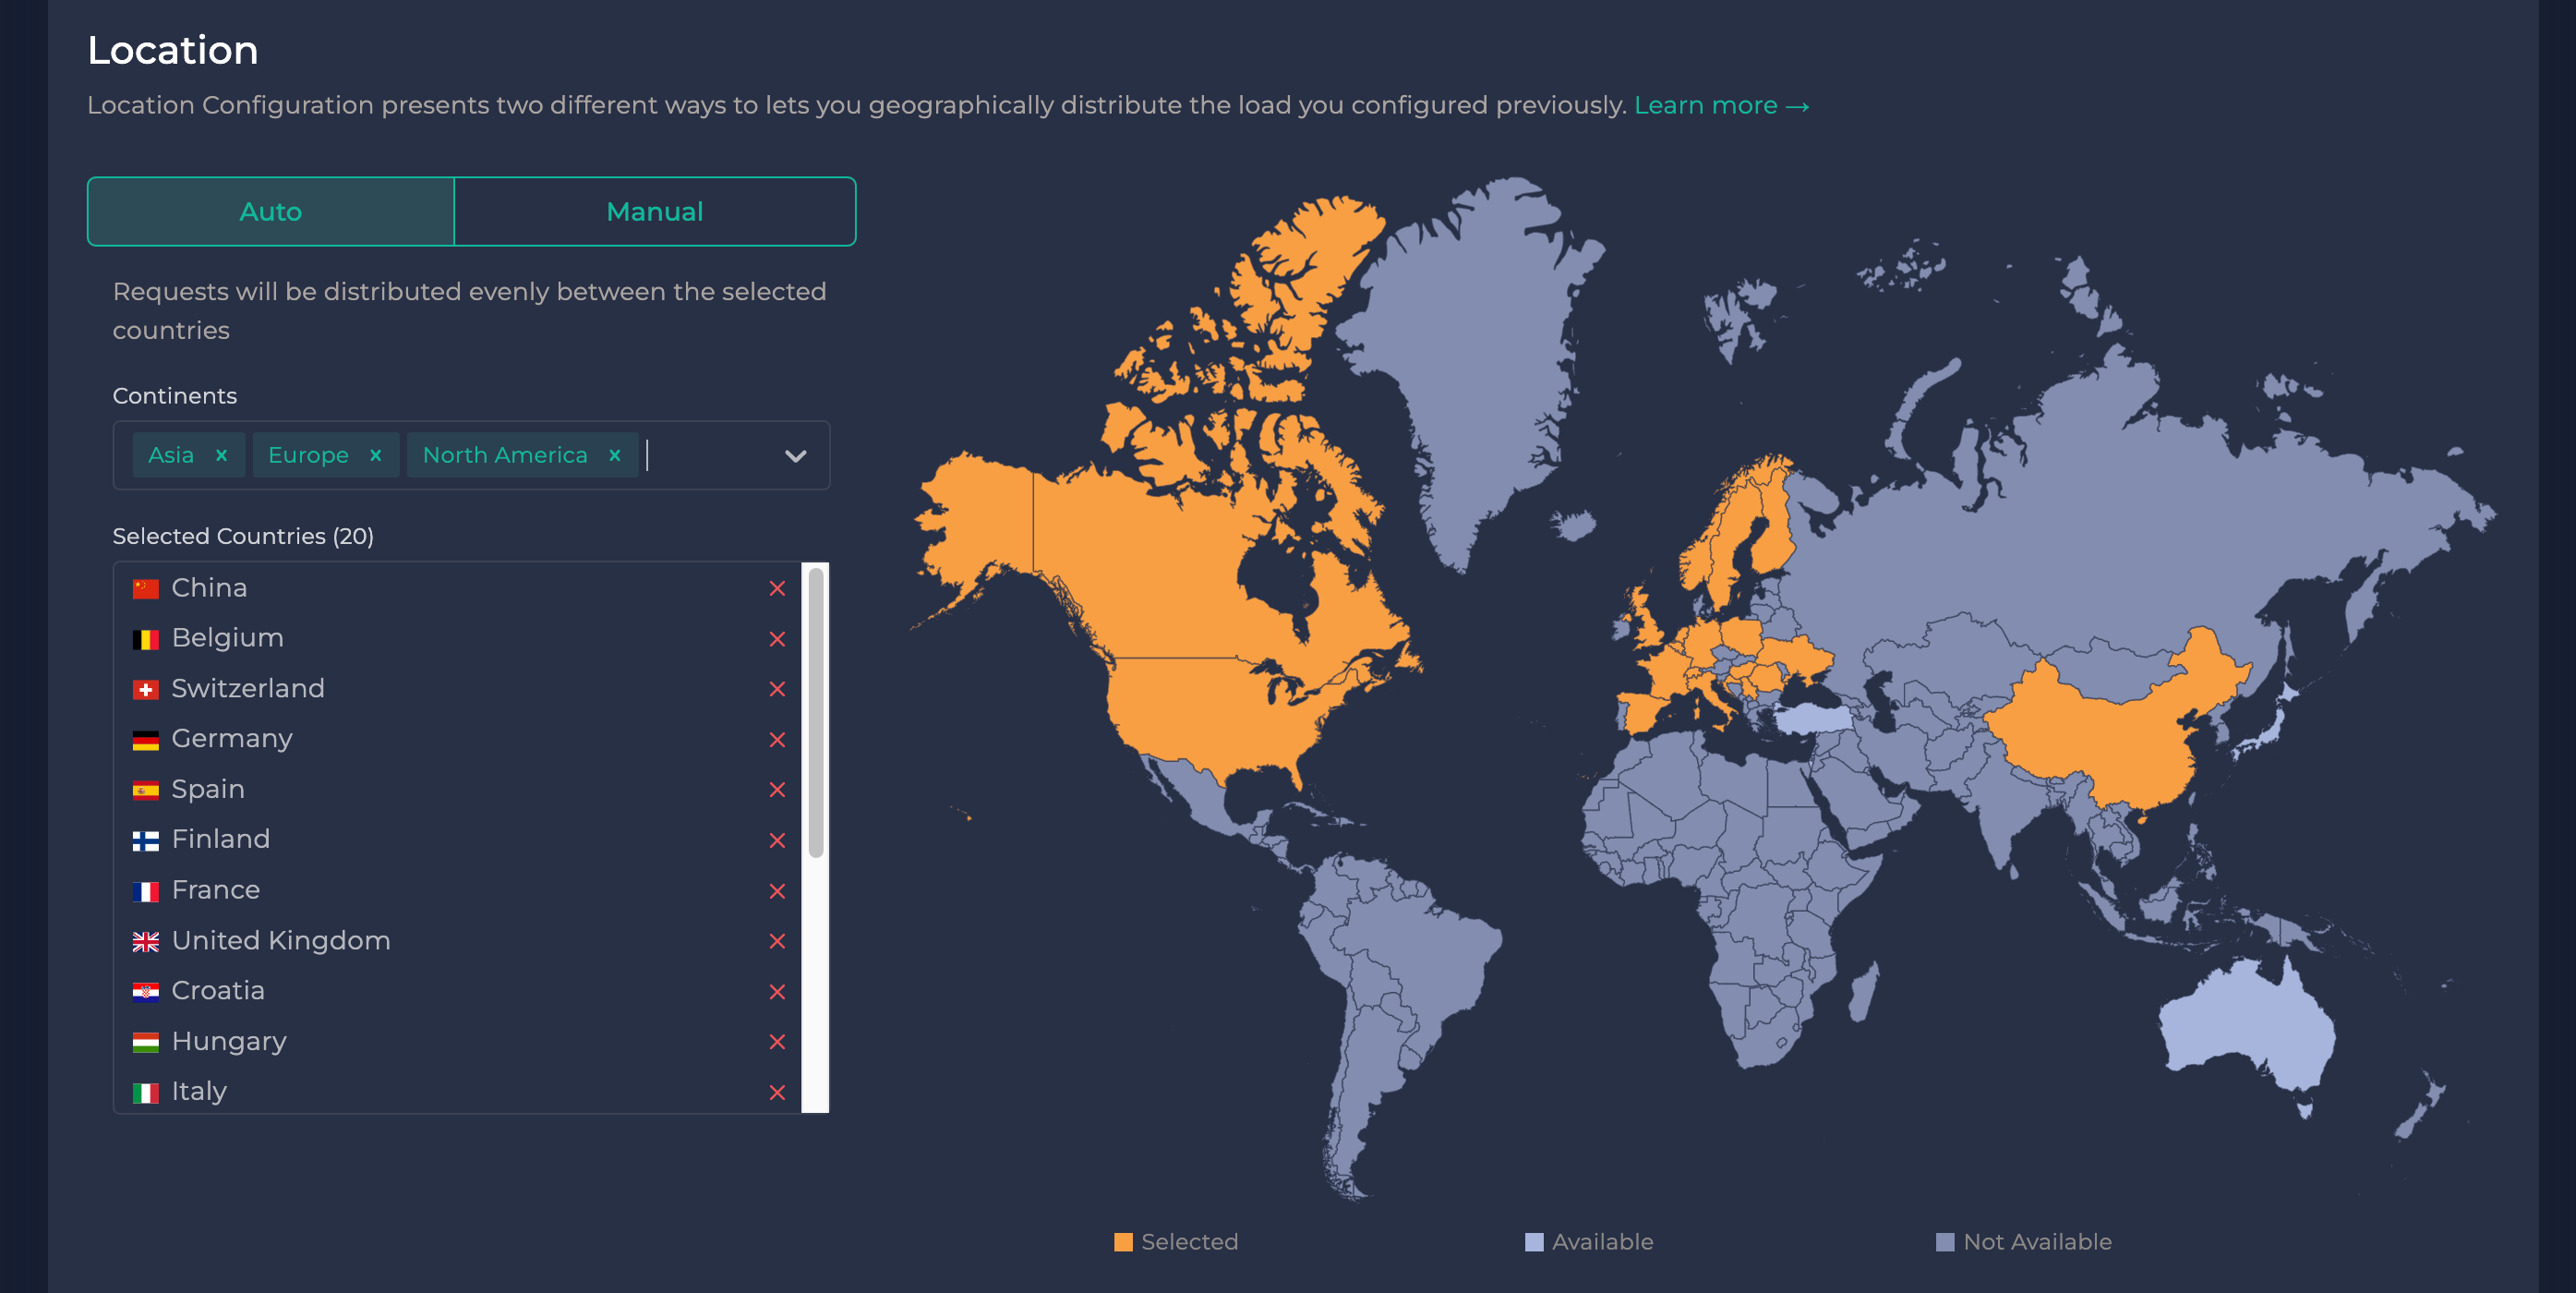
Auto Distribution
Opt for auto mode when you prefer not to allocate load volumes for individual countries. In this mode, Ddosify evenly distributes the load across your chosen countries. For instance, if you select 5 countries and have a total of 100 iterations, Ddosify sends 20 (100/5) iterations from each location.
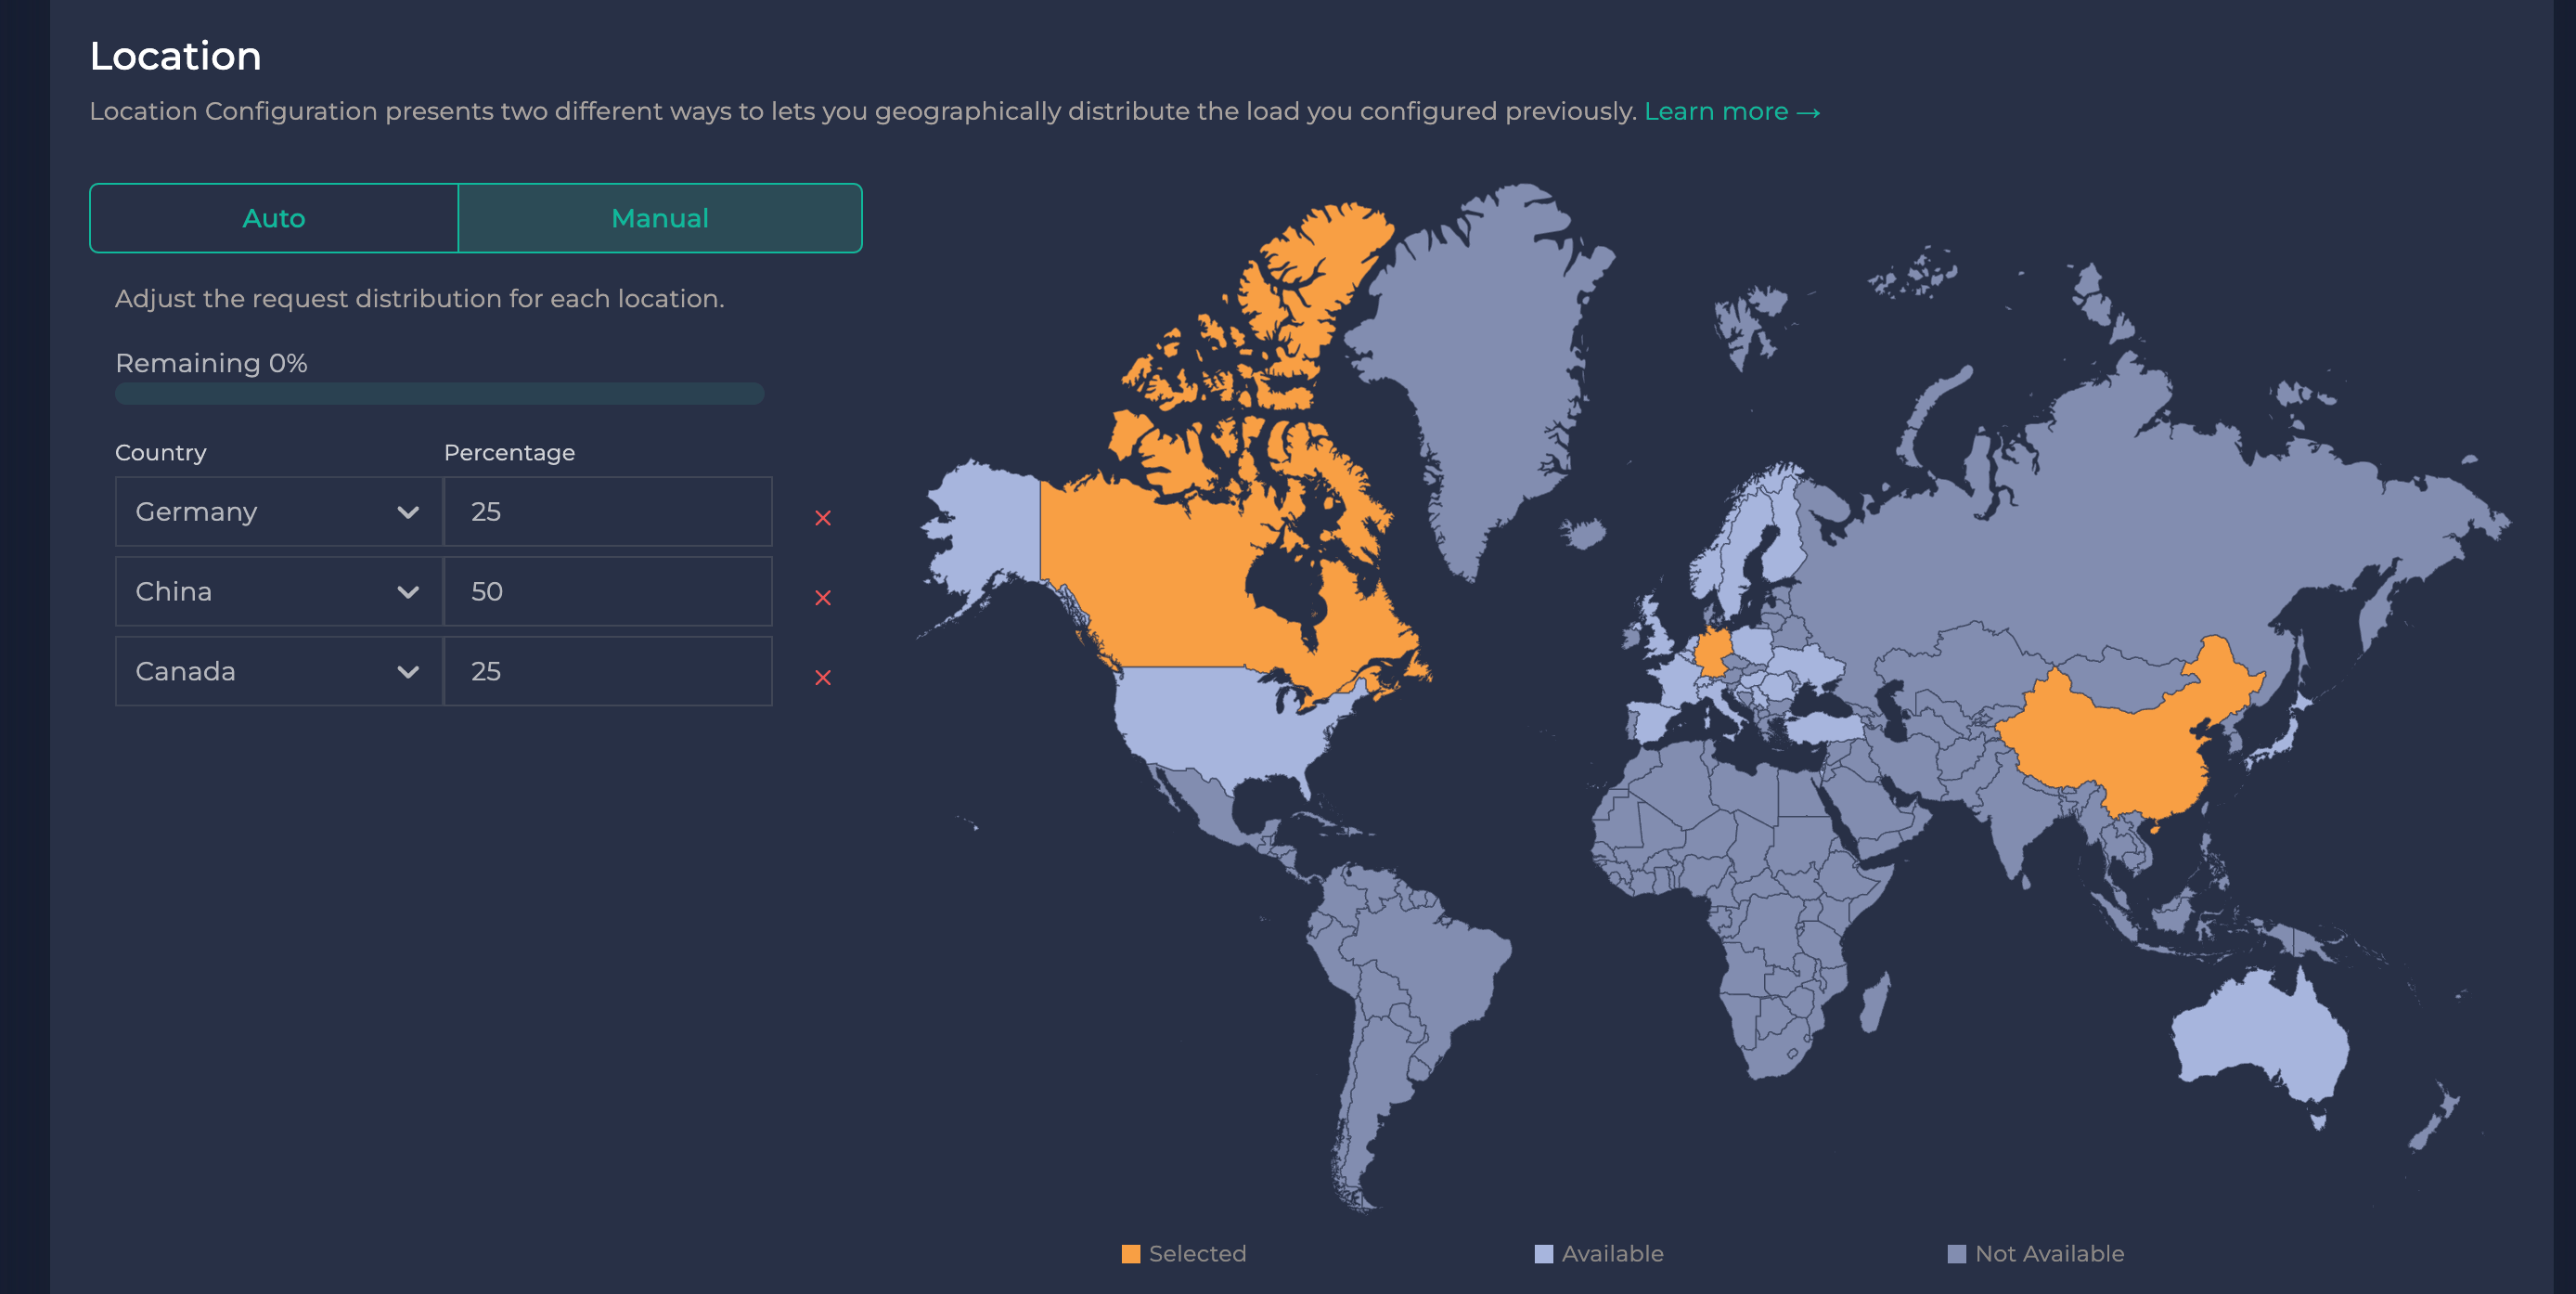
Manual Distribution
Choose this mode if you prefer to personally allocate the load across different countries. This option provides you with greater control over the distribution of the load.
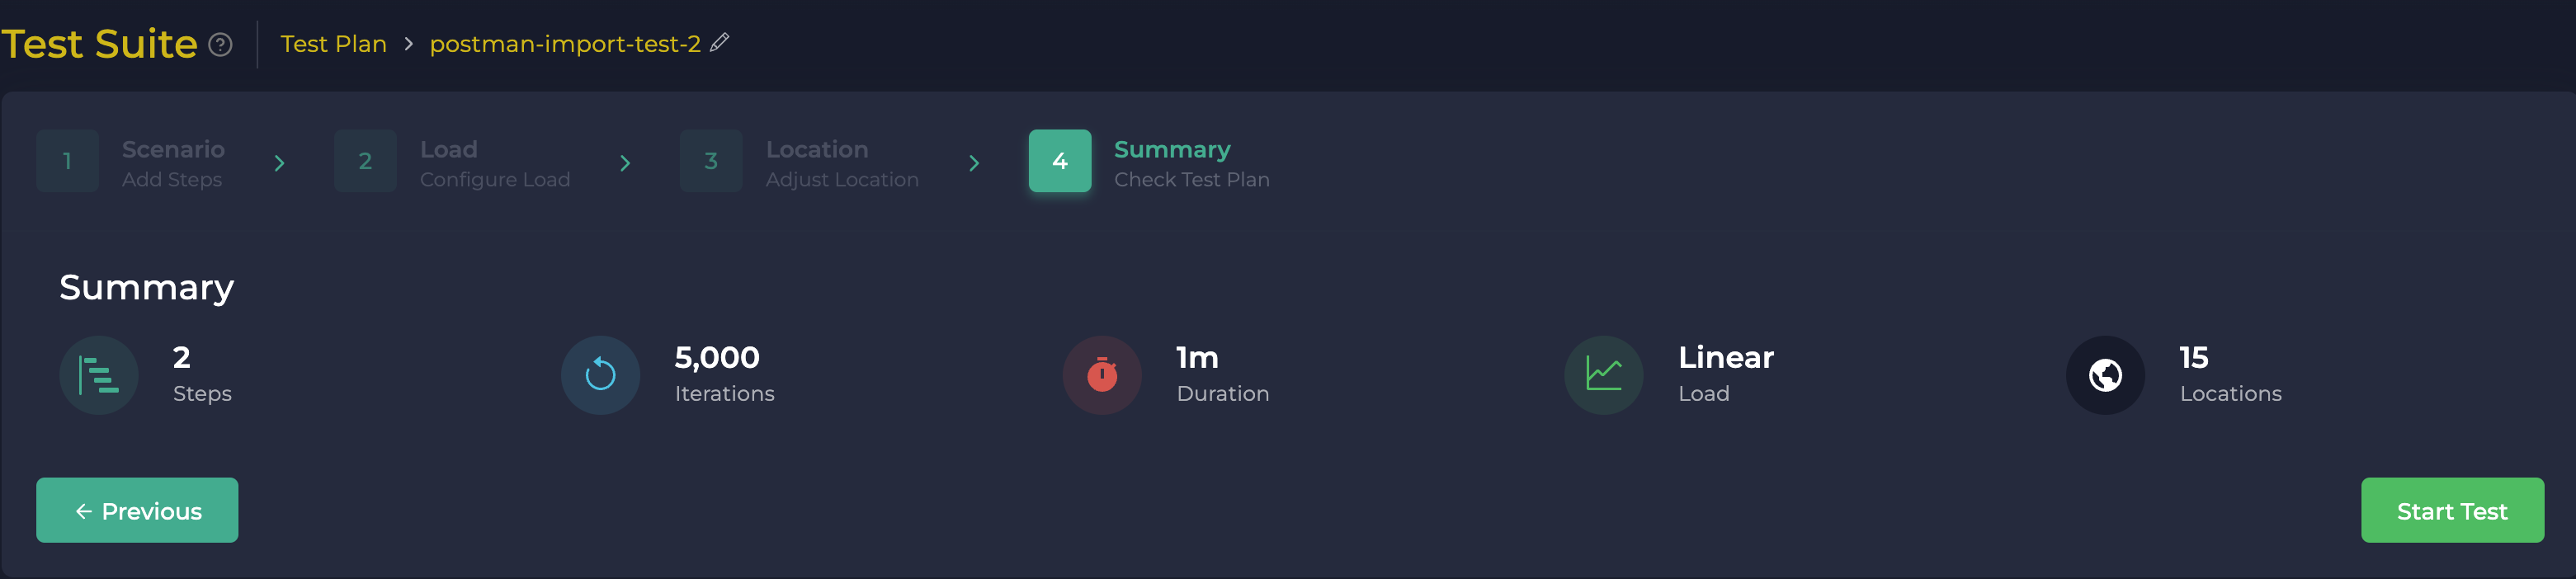
Finalize
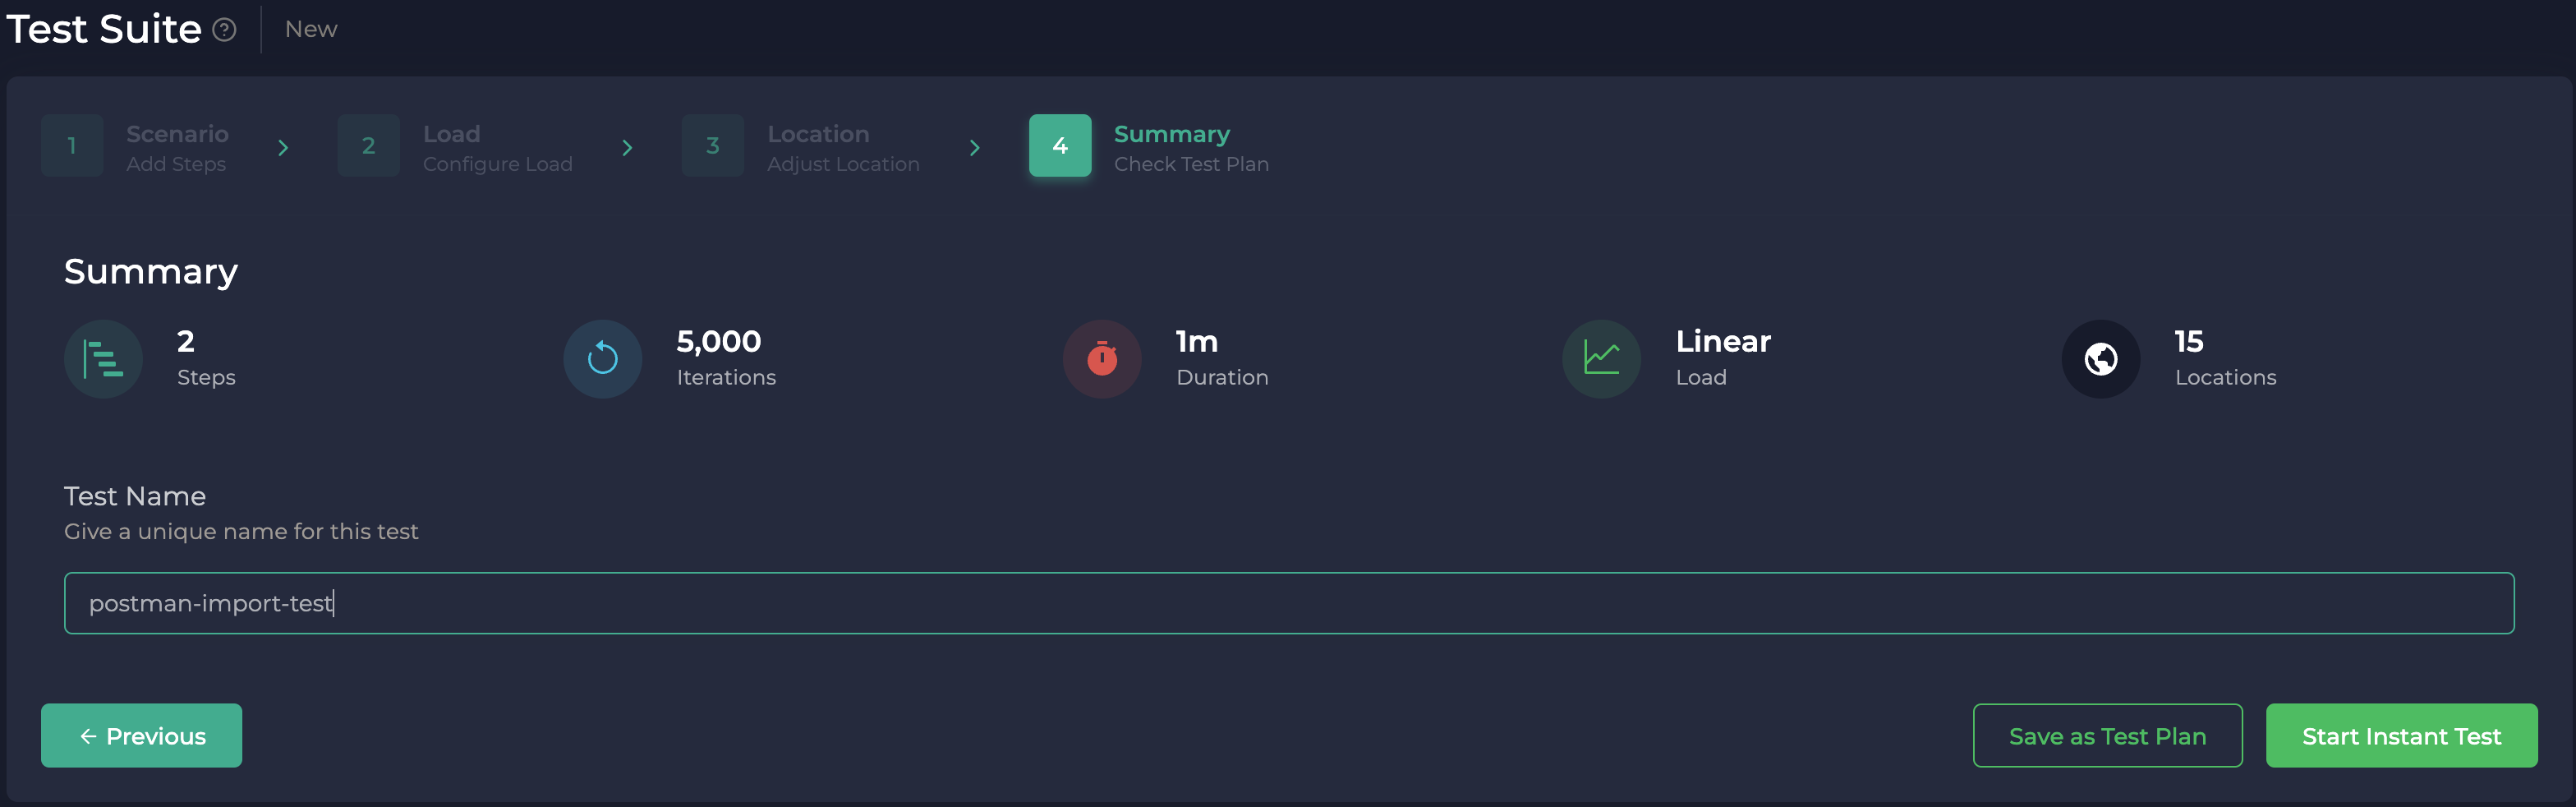
After setting up your scenario, configuring the load, and distributing it across locations, you now need to decide what to do with this configuration. You can launch the test immediately or save the configuration as a Test Plan for future use.
Starting a New Test
- First, enter a unique test name, which is required to differentiate test results.
- Click the "Start New Test" button.
- If successful, you will be redirected to the Live Test Reporting Page.
Saving as Test Plan
- To save the configuration for later use, enter a unique test plan name and click "Save."
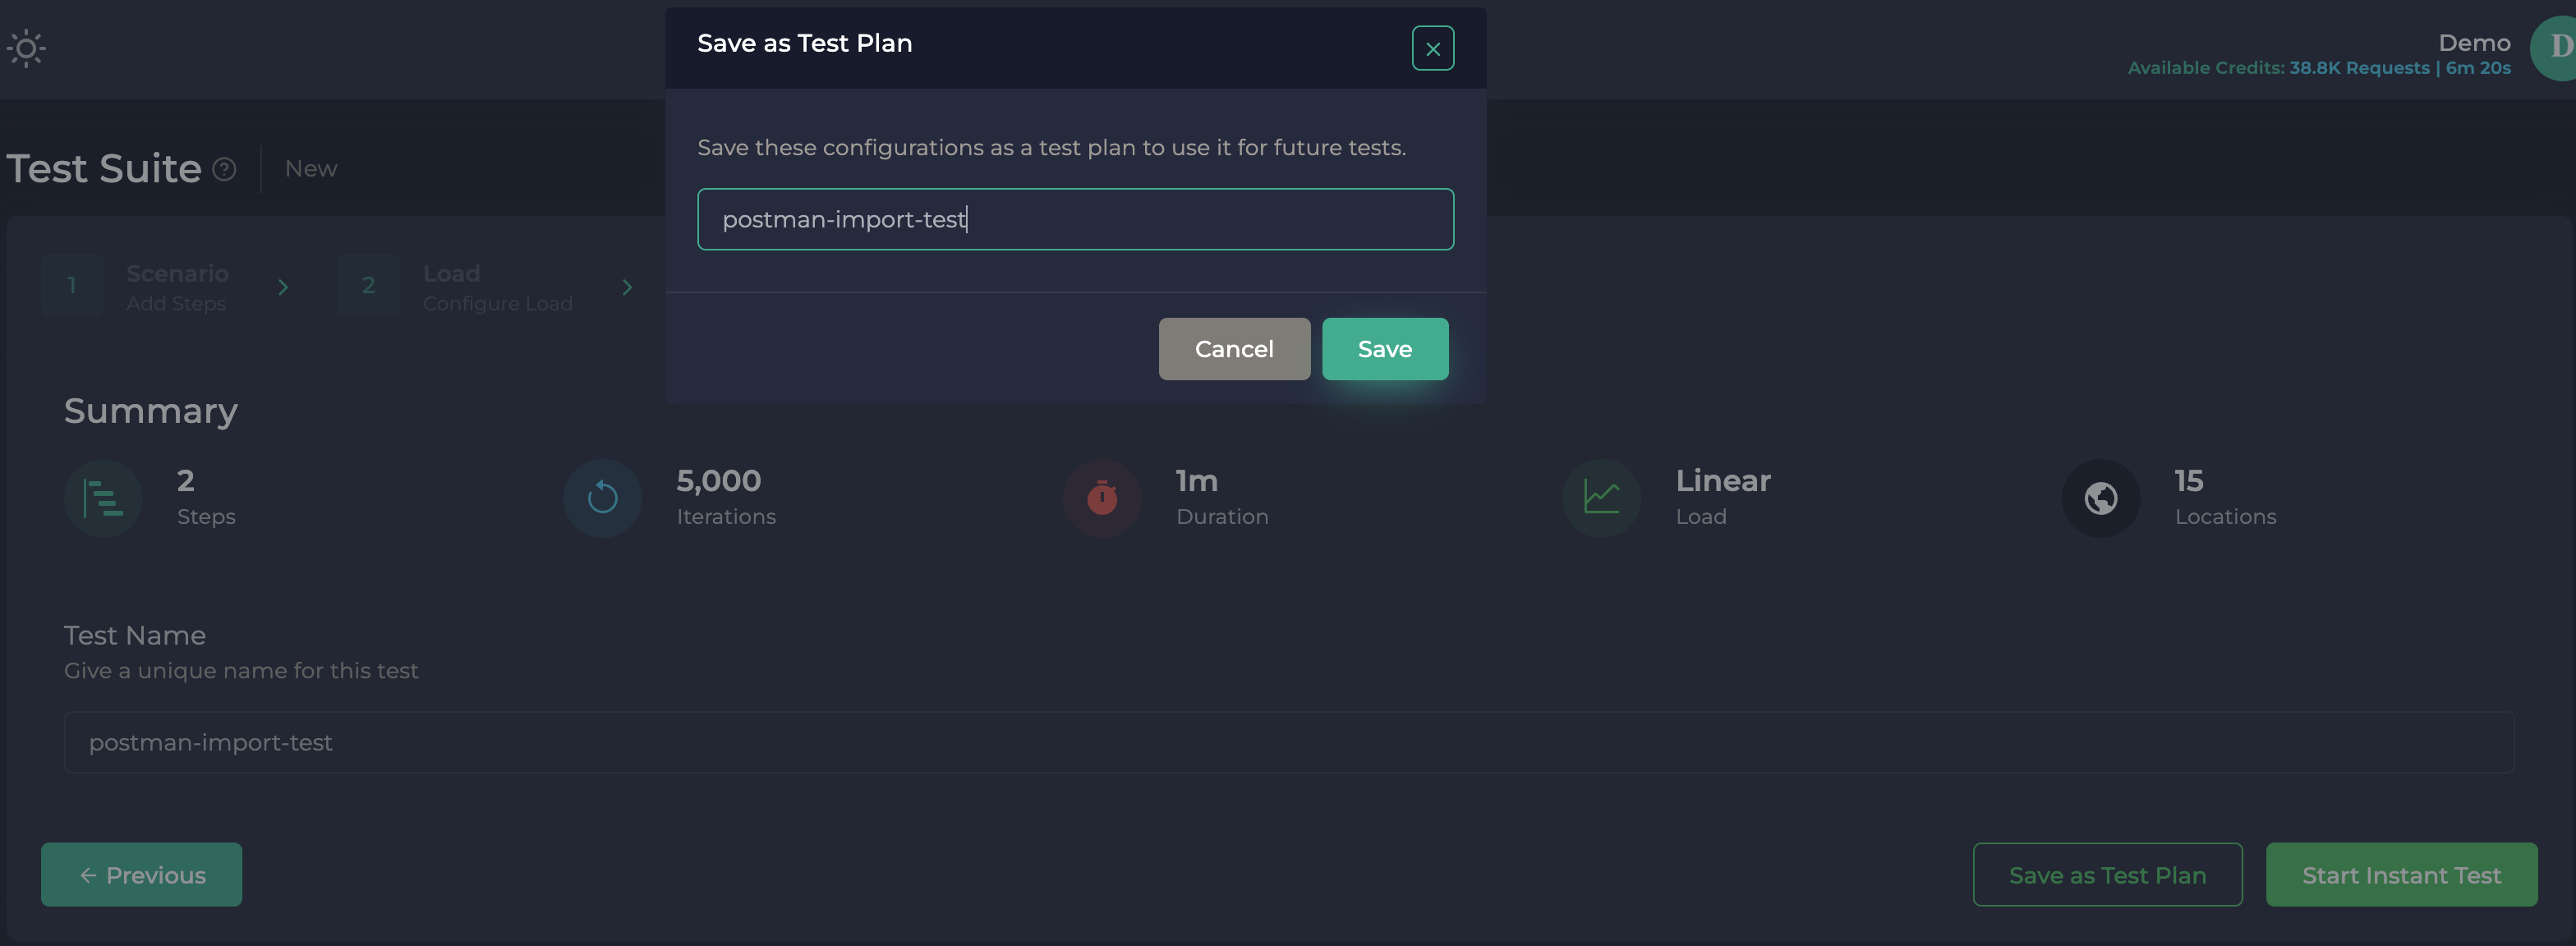
- If the test plan saves successfully, you will see the test plan name displayed next to the Test Suite title, indicating that the Test Suite has switched from "New" to "Test Plan Edit" mode. Any subsequent changes will update this test plan.
To create a new test using a saved test plan, simply enter a test name and click the "Start New Test" button. If successful, you will be redirected to the Live Test Reporting Page.
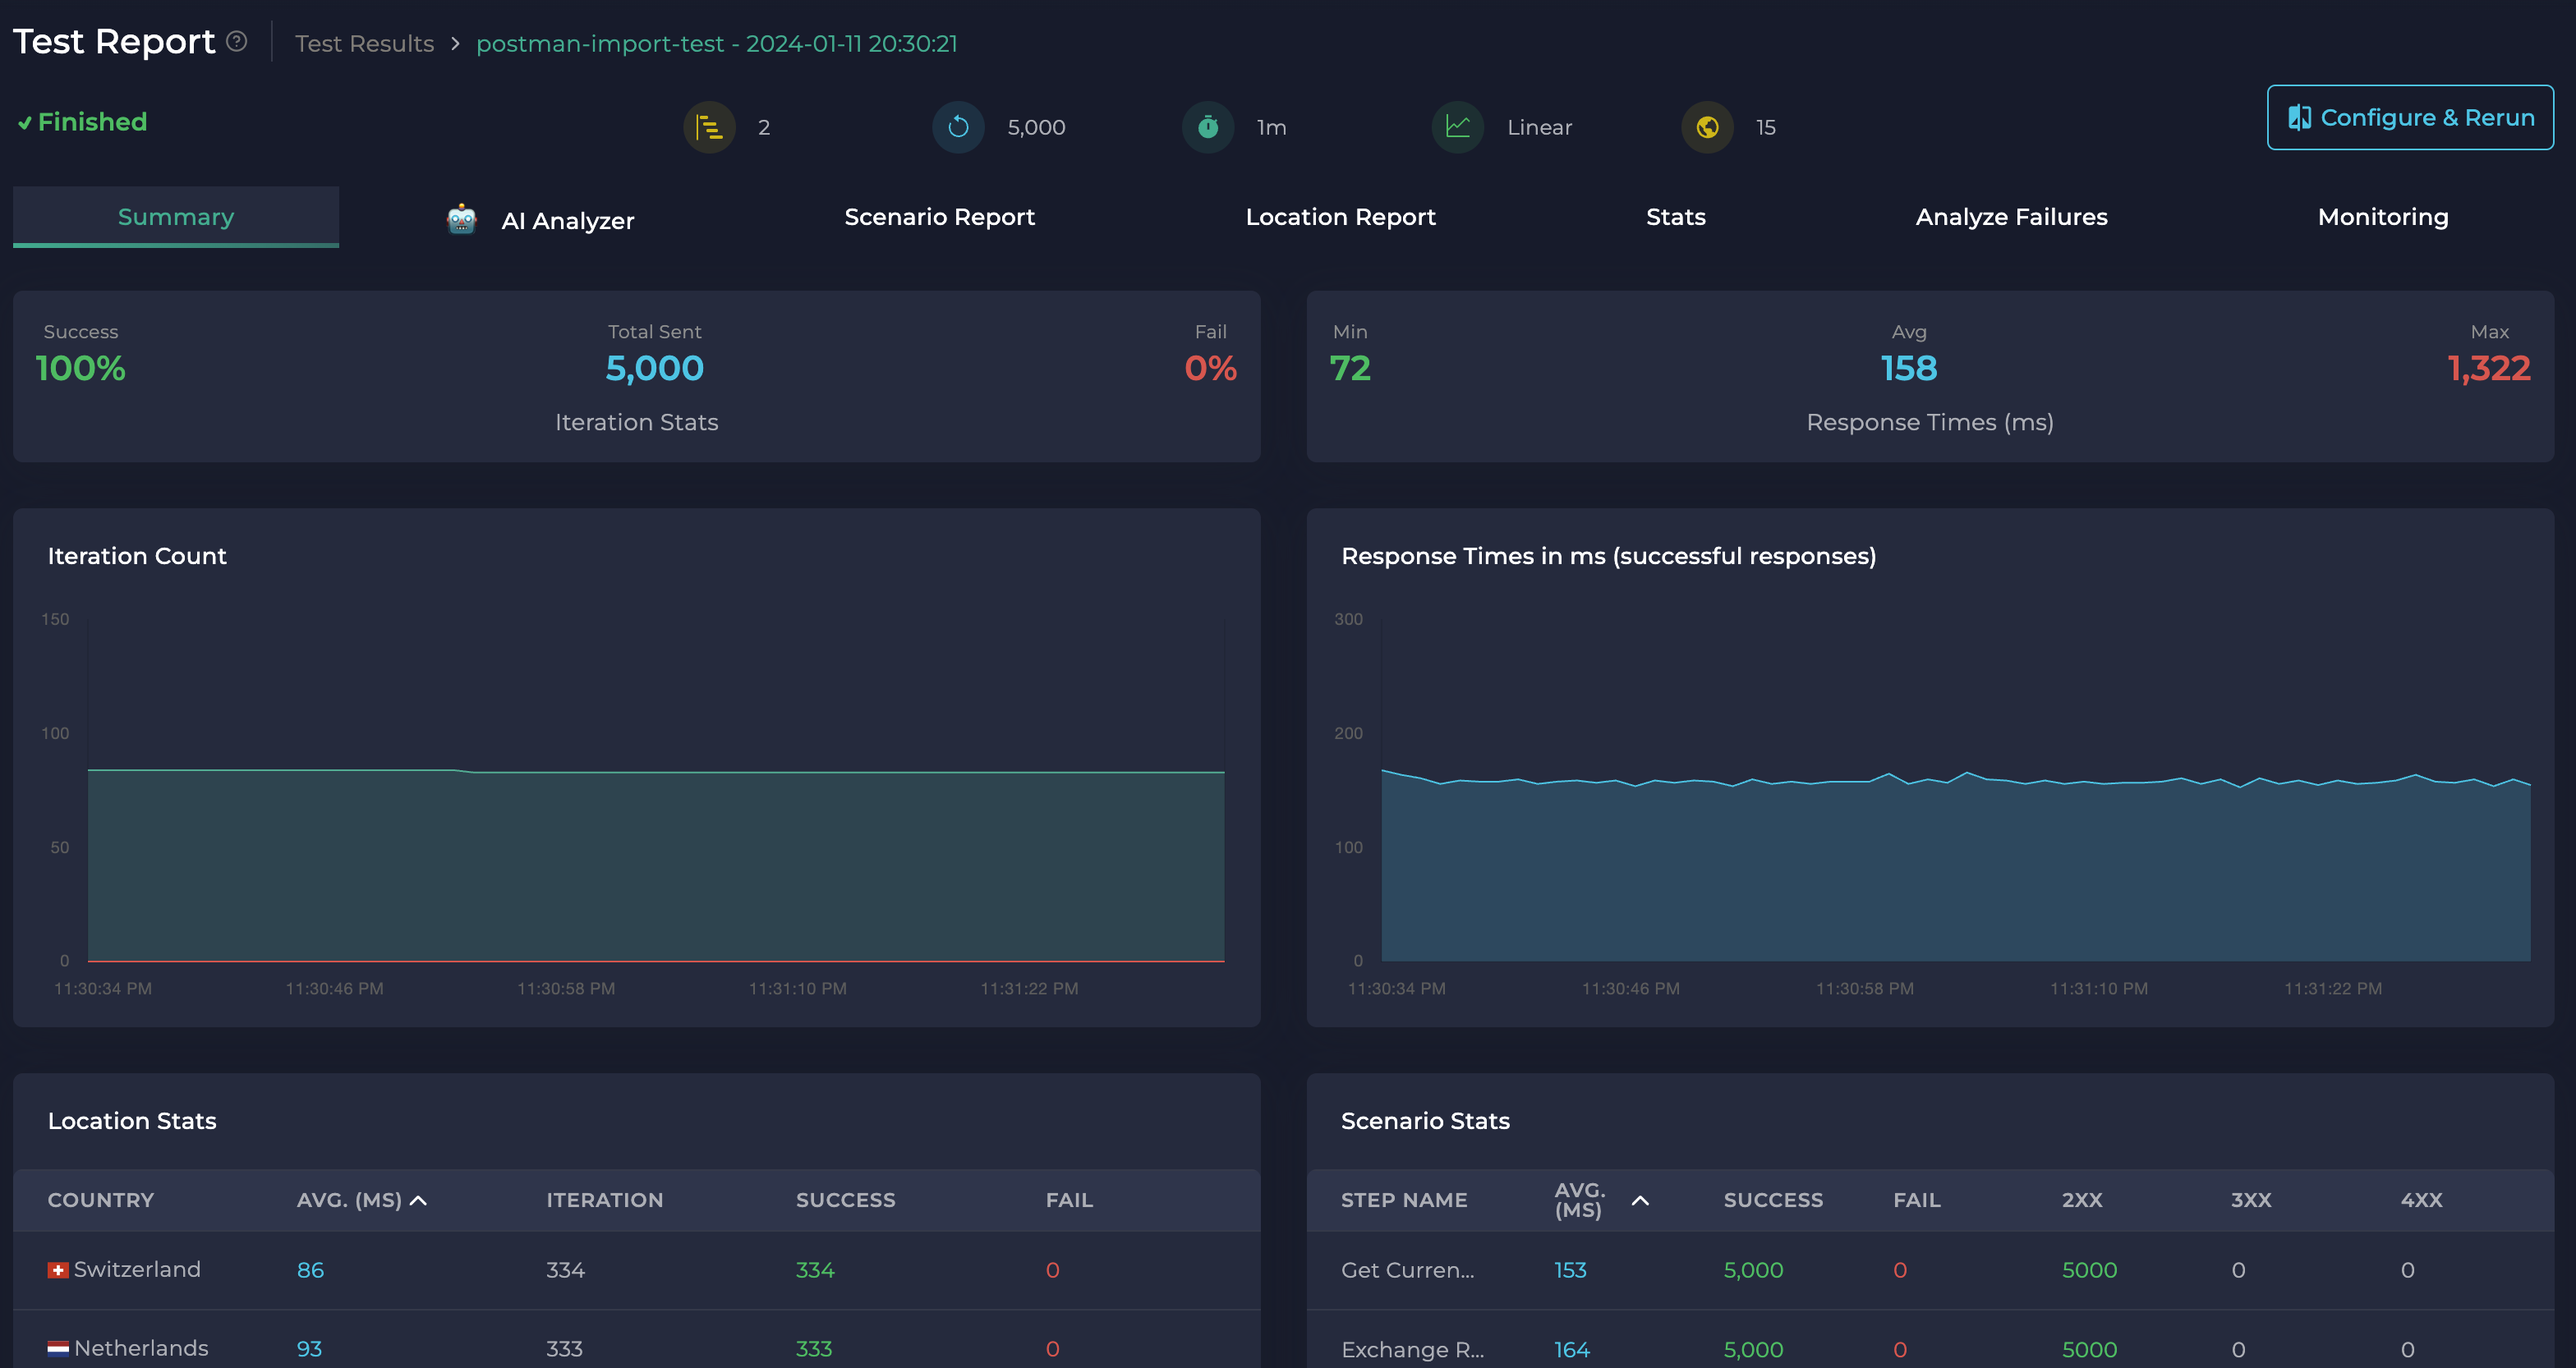
After the test is completed, you can see the test results on the Test Report Page.
If you are wondering Frontend Performance Monitoring Tools you can check out Frontend Performance Monitoring Tools in 2023 blog.
Conclusion
In conclusion, navigating the process of conducting a Performance Test in Ddosify using Postman Import is straightforward and manageable once you understand the steps involved. It all begins with successfully importing Postman into Ddosify. Debugging provides a quick way of performing load tests with your providers within Test Suite steps. The environment is the area where you can create your variables that are frequently used in load test steps. Preparing for the Load Test gives you valuable insights into the functional capabilities and limits of your system under various stress levels. Finally, you kickstart the load test, initiating actions that will subsequently provide you with extensive data on your system's performance. Mastering these steps will undoubtedly enhance your performance testing capabilities and make Ddosify and Postman valuable tools in your toolkit.
Share on social media: