

As we march closer towards the much-anticipated holiday of love - Valentine's Day, eCommerce businesses are expected to experience an incredible surge in online traffic. With shoppers worldwide hunting for the perfect gift for their loved ones, the robust performance of your eCommerce site can make or break your business's success. So, how about we uncover the secret to achieving seamless website performance this Valentine's Day? Say hello to Ddosify, a state-of-the-art performance testing and Kubernetes Monitoring Platform.
Simplifying Kubernetes Monitoring with Ddosify
Ddosify offers an array of features to ensure your website's performance stays at its peak, no matter the volume of incoming traffic. By leveraging the capabilities of eBPF, Ddosify promises a ridiculously simple setup with "kubectl apply" command for instant visualization of your cluster's service map. This unparalleled tool requires no code changes, no sidecars, no instrumentation, and more importantly, no service restarts. This simplicity ensures there is no downtime, and your website is available 24x7 for shoppers.
Looking for a way to keep an eye on your Kubernetes Cluster without breaking a sweat? Ddosify Observability is your one-stop solution! Just a simple task of running our open-source eBPF agent – Alaz – as a DaemonSet on your Kubernetes cluster, and you are done. Leave the rest to us! Ddosify will assemble everything else for you. Before you know it, the Service Map, Metrics Dashboard, and Distributed Tracing will be waiting for you on the Ddosify UI. It's as smooth as it gets!
If you are new to Kubernetes, you can check out the Kubernetes 101 - Introduction & Architecture blog post to get started.
Spotting Bottlenecks in Real-Time
Efficiently managing increased traffic during Valentine's Day season demands quick identification of bottlenecks and instantly addressing them. Ddosify emerges as your best-hearted partner industry-leading features, allowing you to send traffic to your cluster, spot bottlenecks in real-time, and tackle them swiftly, ensuring seamless user experience.
Following features in Ddosify help you spot bottlenecks in real-time:
Service Map
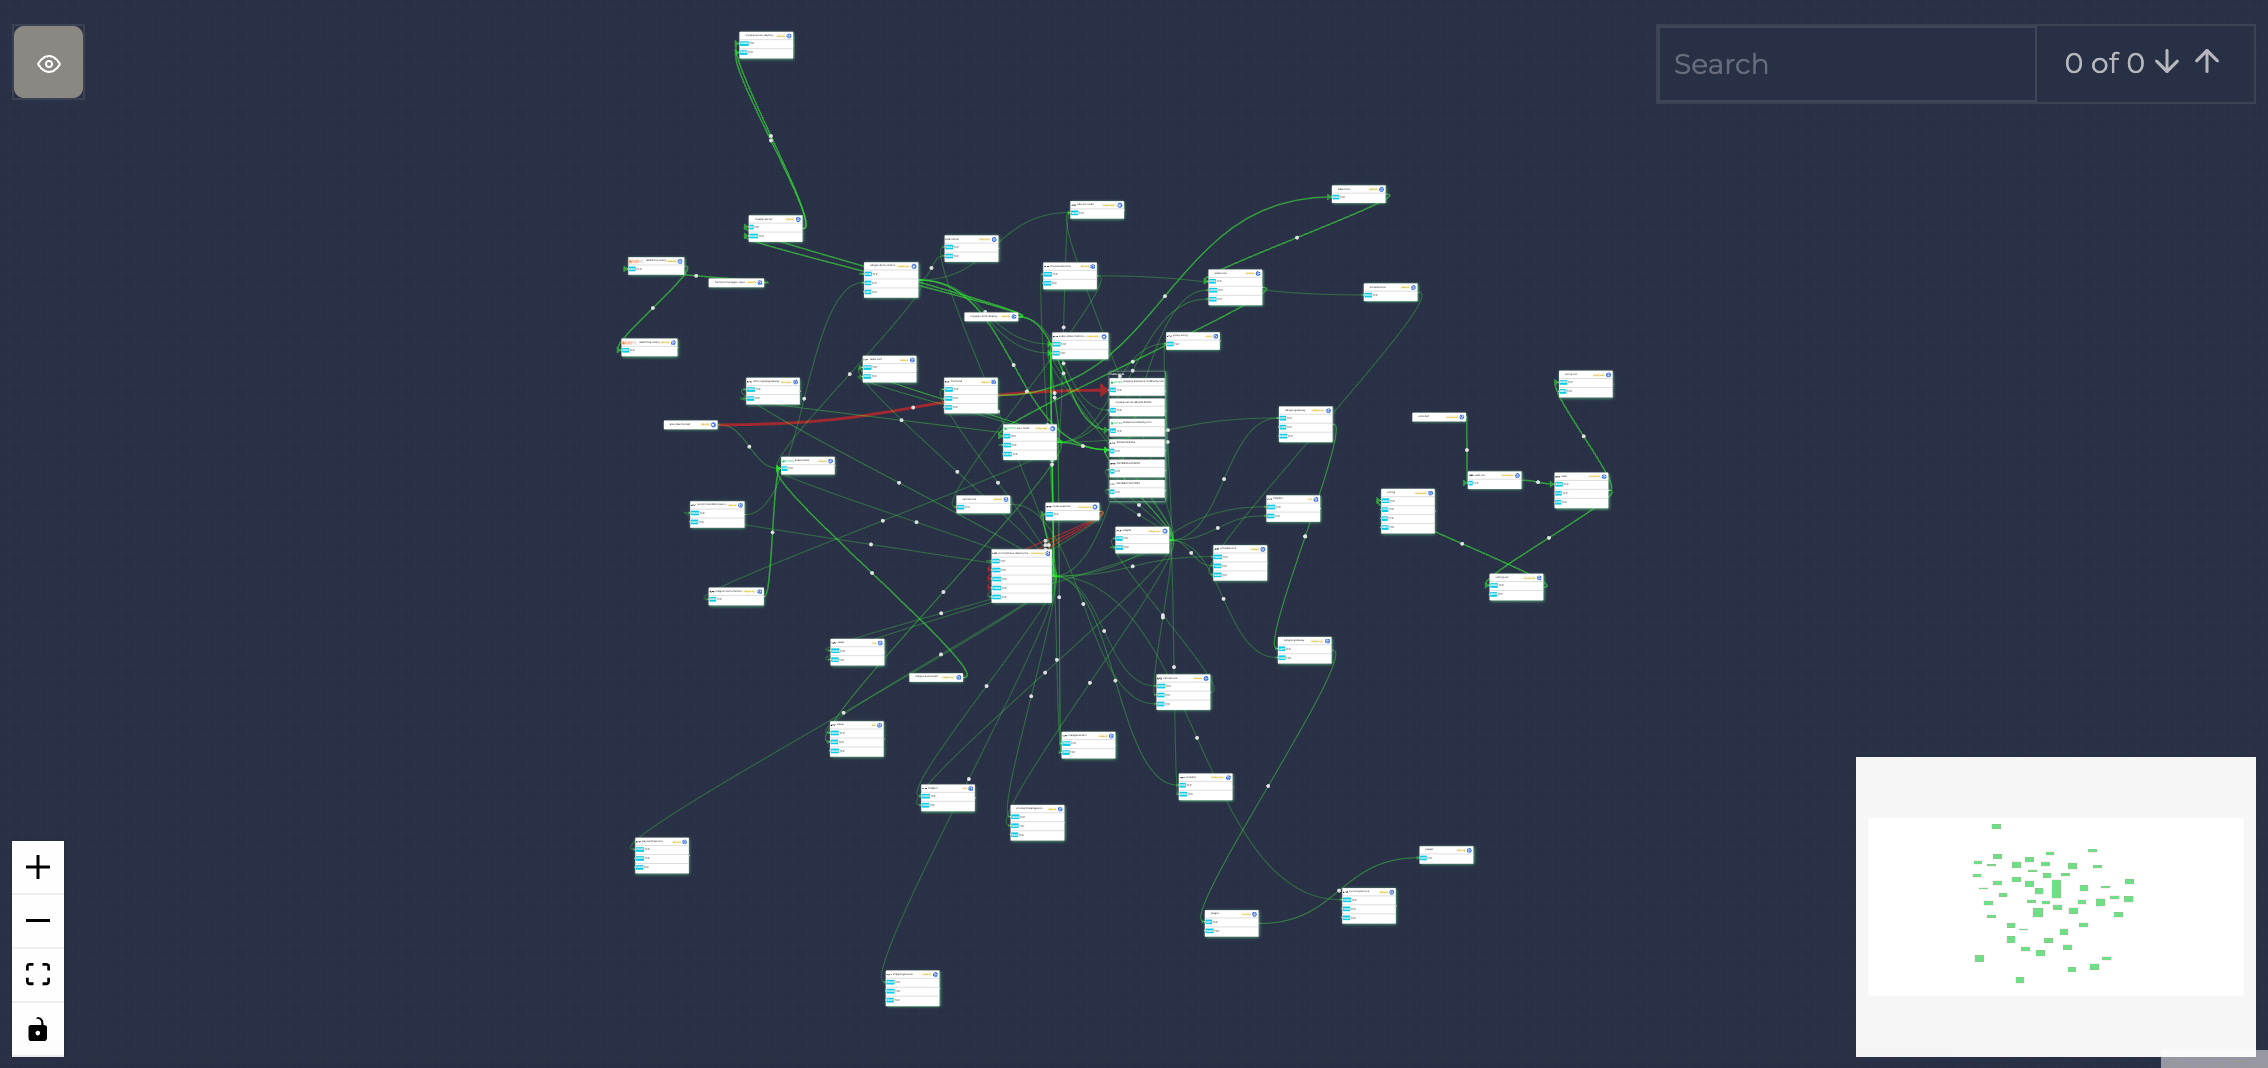
Think of Service Map as your personal guide to sail smoothly through your K8s Cluster. It's a handy tool that lets you see how different resources within your cluster are interacting with each other. And it's not just static information - you get a dynamic view of the outgoing requests, their response times, rate per second, and much more. Plus, you get the power to sieve through this information and filter it based on your needs, helping you discover insights that matter. It's like having a magnifying glass for your cluster, showing only what you wish to see!
If you are interested in detecting slow SQL queries on Kubernetes before your customers do, you can check out the Detect Slow SQL Queries on Kubernetes Before Your Customers Do blog post.
Metrics
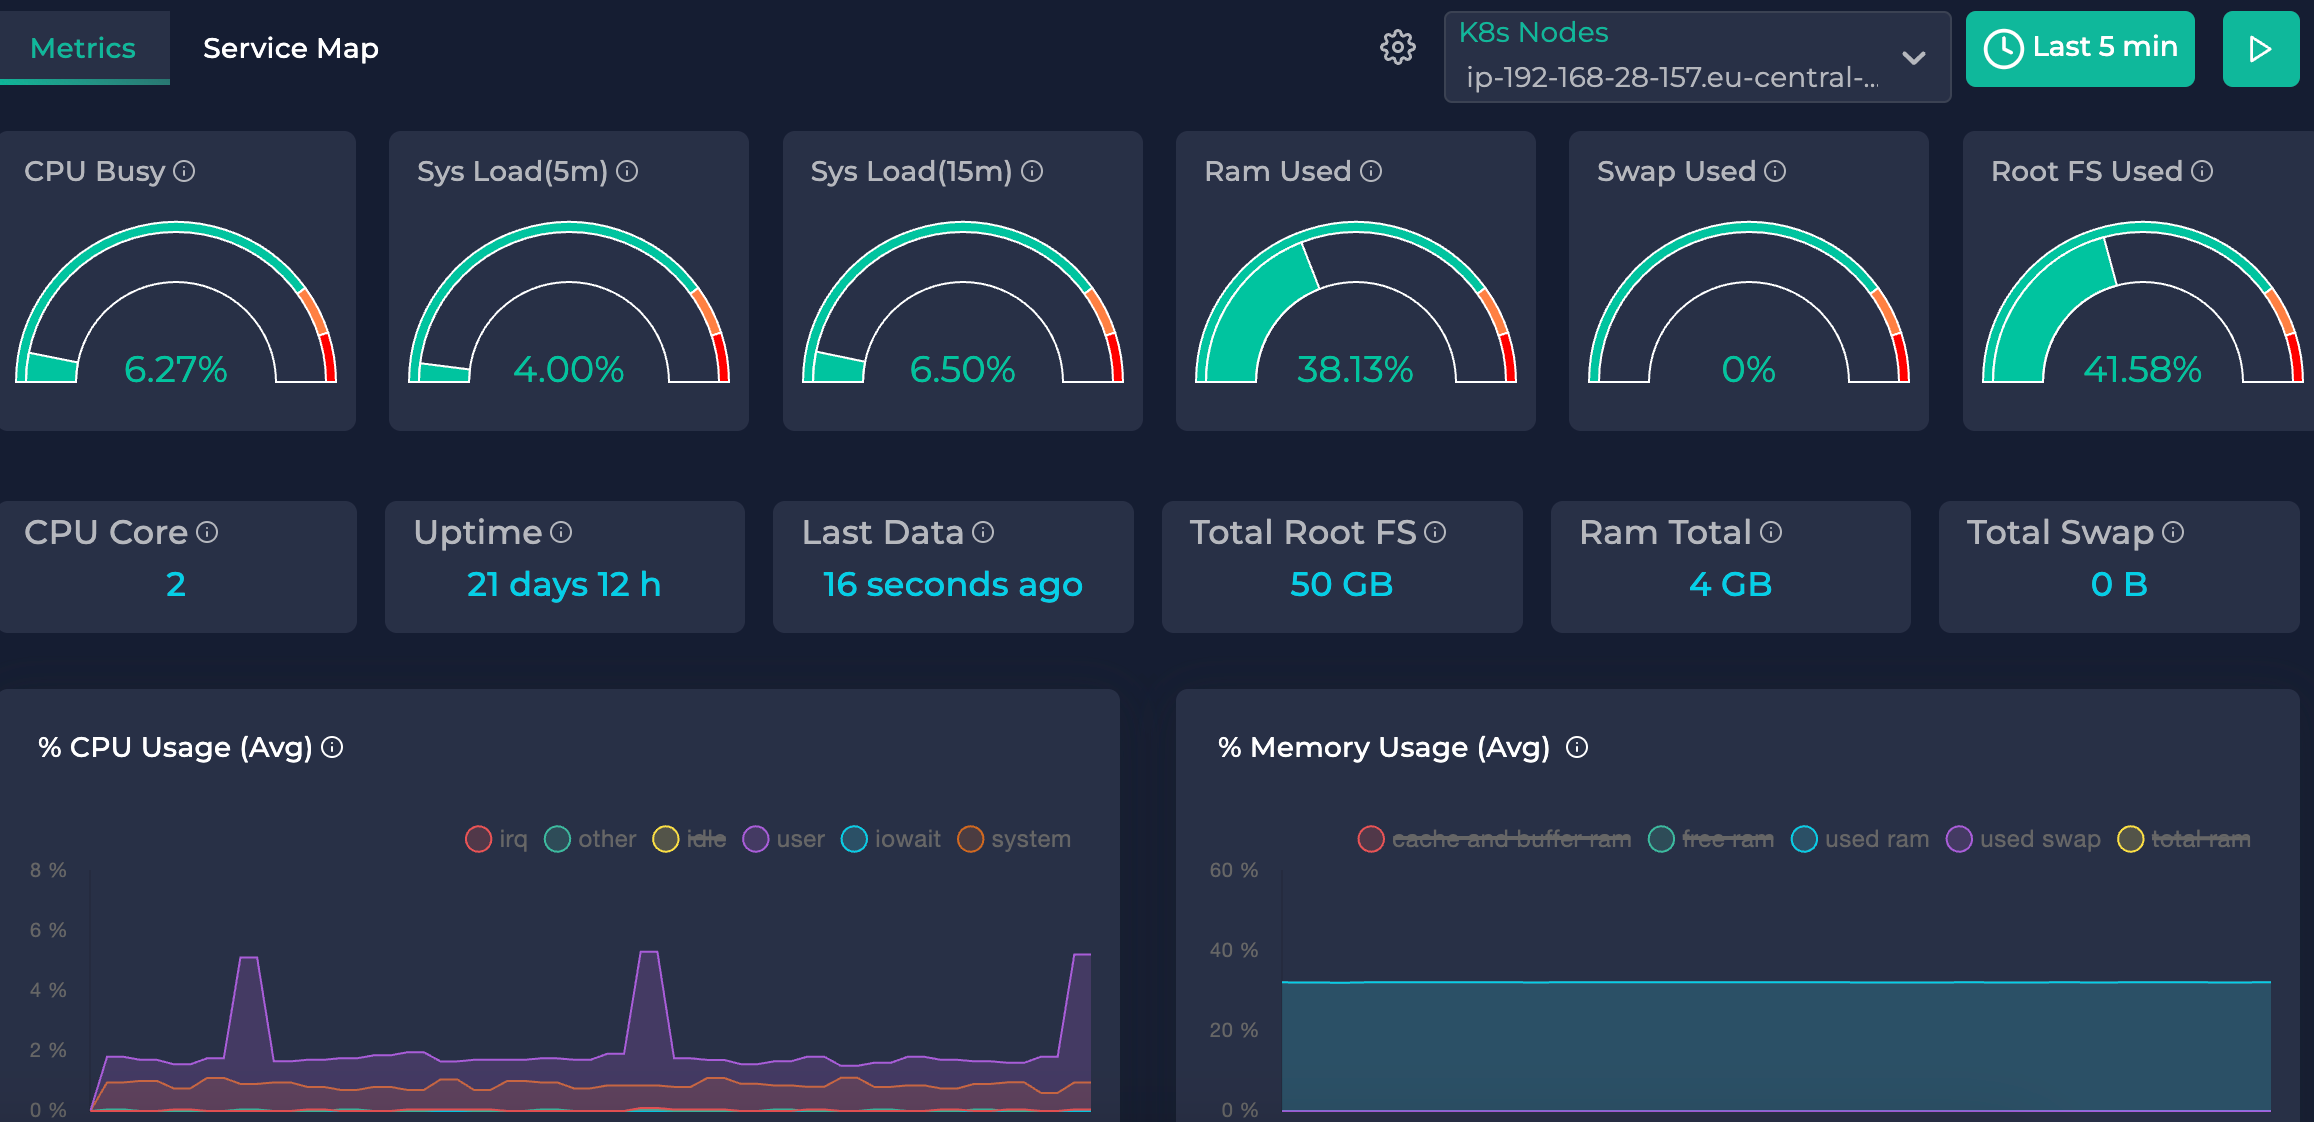
Want to peek into the behavior of your Kubernetes instances? Metrics let you access all the vital stats, such as CPU, memory, and disk usage. But that's not all! You can watch how these figures evolve over time and should you wish to zoom in onto a particular time frame, you can do so with time filtering. So, whether you're interested in the bigger picture or the specifics, Metrics have got you covered!
Distributed Tracing
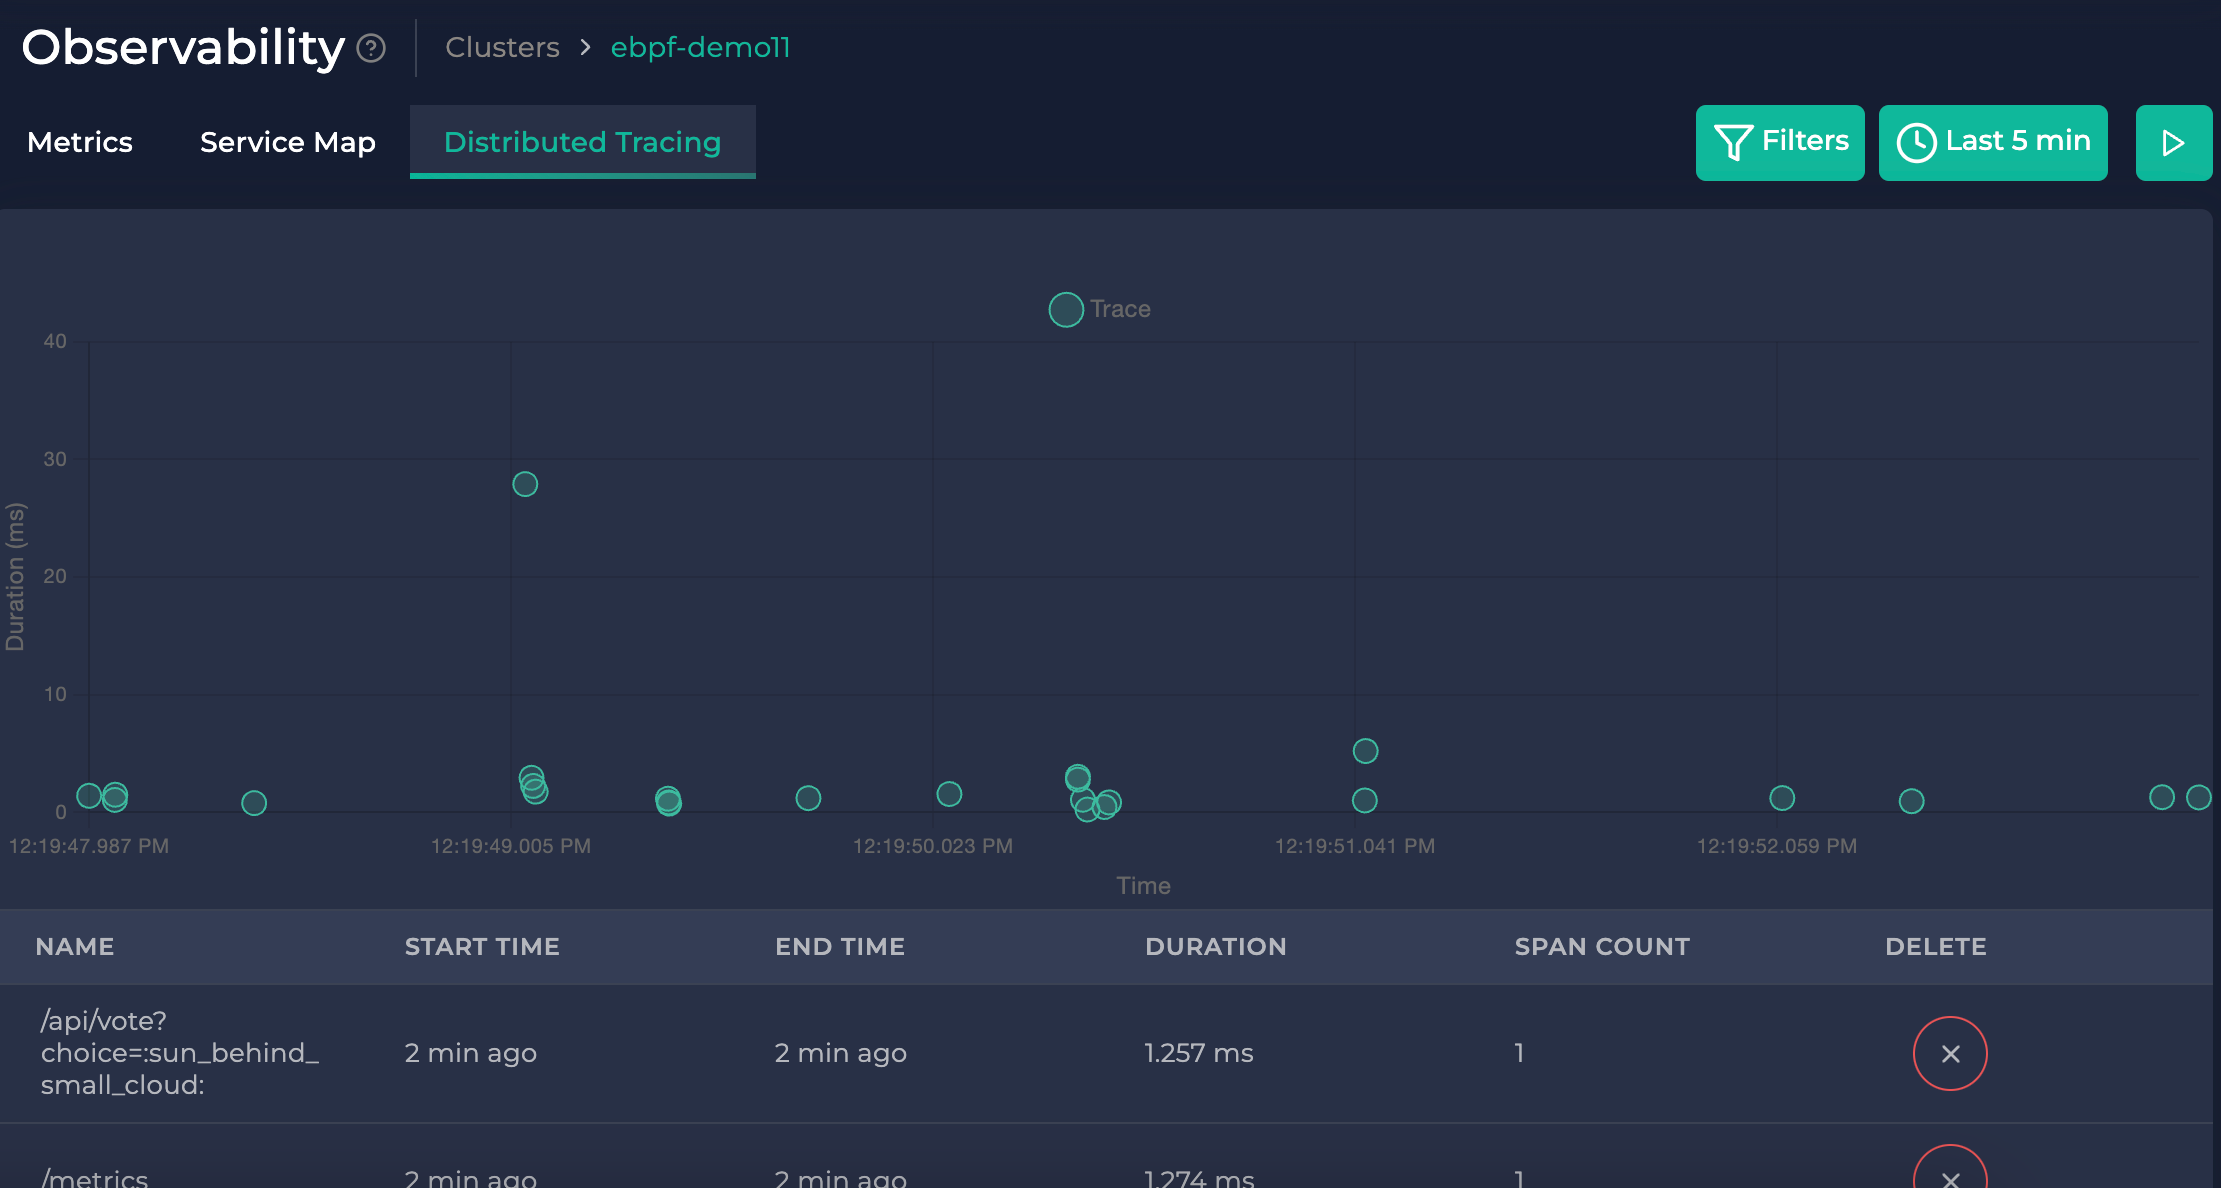
Distributed tracing offers you a handy way to follow the path of requests sent within your cluster. Best of all, you don't have to create any custom span or do any manual setup yourself. It's like having a map in your hands, showing you the trail of requests, which ones set off others, how long they took, and their sequence of events. It's an easy, visual, and user-friendly way to understand your cluster's activity.
Trace Details
Once you select a trace (from either the chart or list), you'll be able to dive into its specifics. This includes details like the sequence of calls it made and the time it took - everything is just a click away!
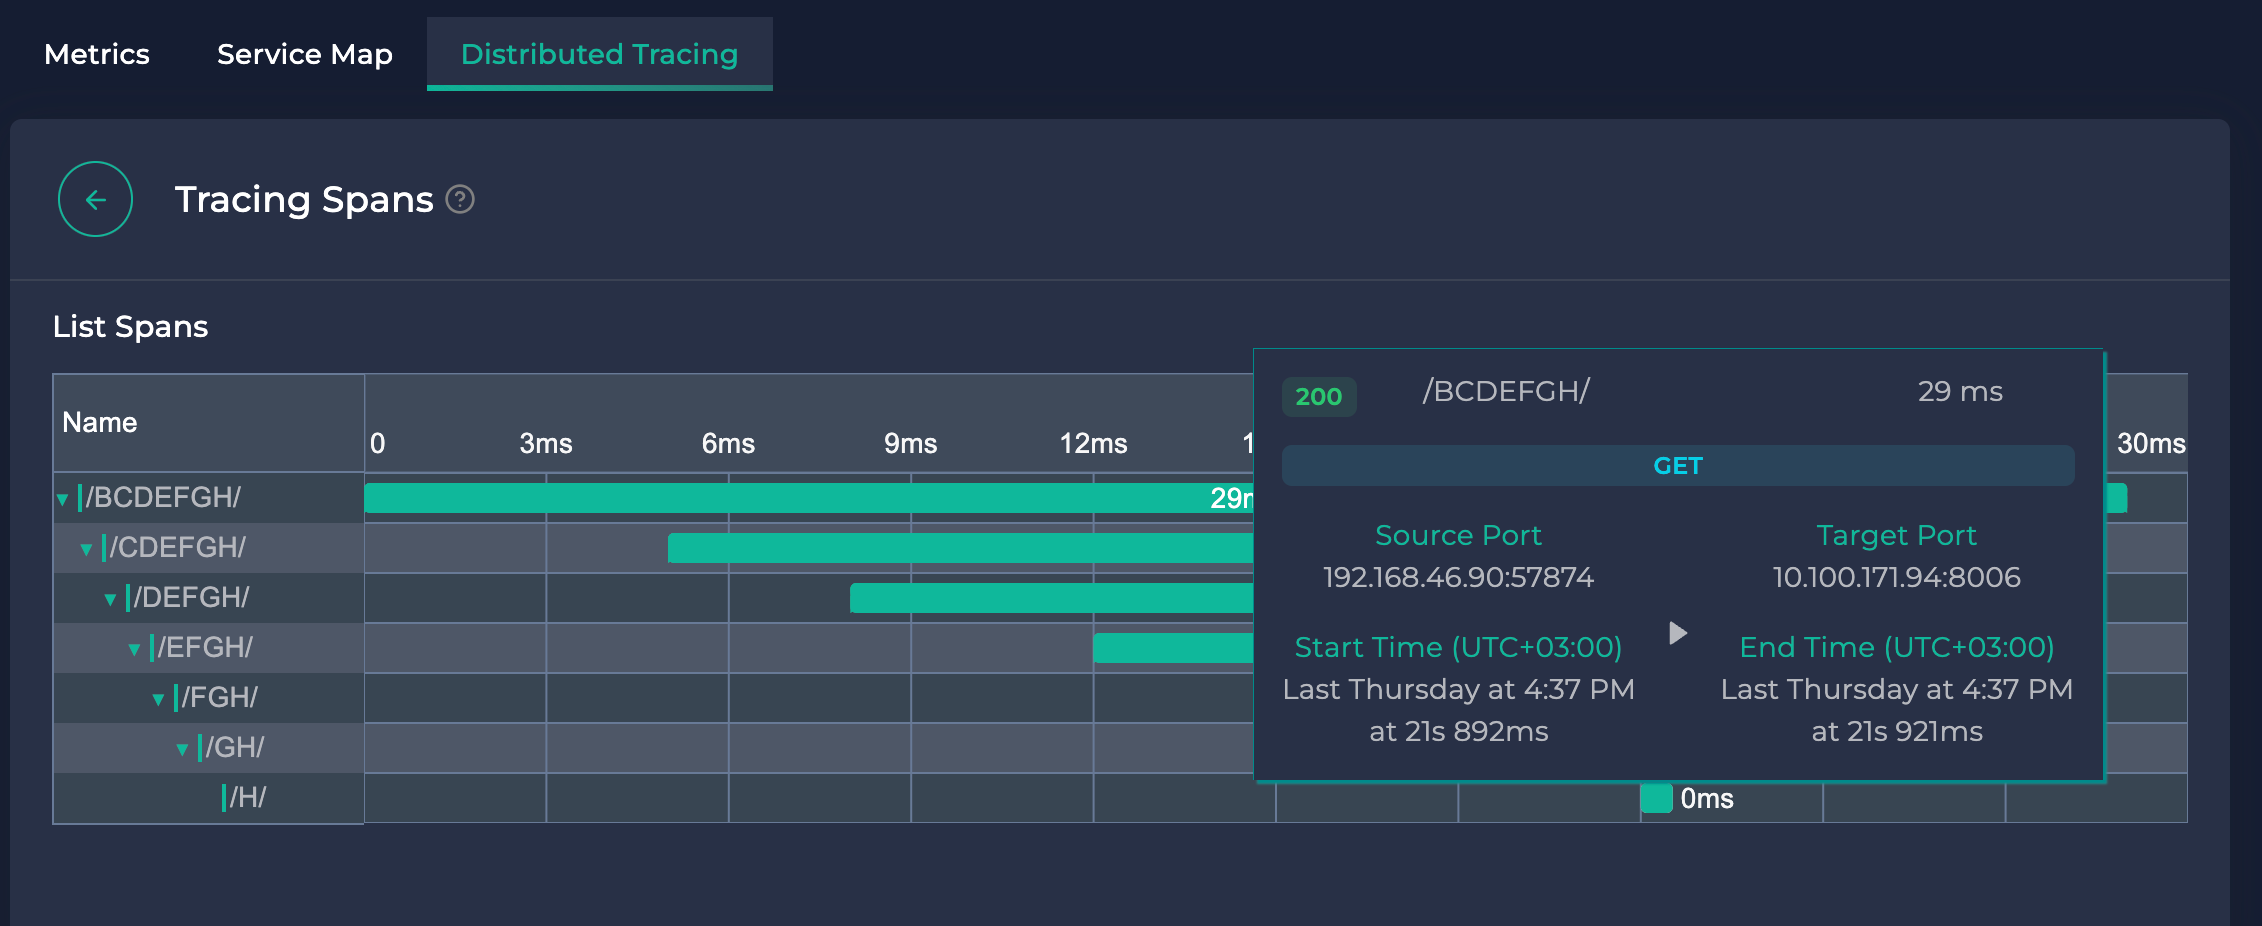
Each row represents a trace, whereas the columns represent the time.
No matter how long your trace took, the whole hierarchy is always fitted inside your view, so you would not need scrolling/zooming to understand the trace.
You can expand/collapse spans by clicking on their "Name" column.
Unfold the Power of Performance Testing
Beyond robust Kubernetes monitoring, Ddosify extends comprehensive performance testing features to eCommerce businesses. With ready access to generate network traffic from 25 different countries, you get a global perspective on your site performance and potential improvements.

Ddosify's innovative AI Analyzer turns the complex test data into actionable insights, helping you make accurate and efficient performance enhancement decisions. Plus, You can create complex and realistic user flows on Ddosify No-code UI. Here are the list of key concepts on Ddosify Performance Testing.
Parametrization
When we're setting up a trial run, it is crucial that our model behaves like an actual user would. The system we use for this test must be capable of introducing unexpected factors at the right spots. This is something Ddosify is designed to to with Parametrization

Ddosify can introduce dynamic variables in various locations, such as URLs, headers, payload (body), and basic authentication settings. It can do this to the same extent as Postman, a top-testing platform.
Remember, in Postman, dynamic variables are represented as {{$randomVariable}}. In Ddosify, we just slightly change the representation to {{randomVariable}}, replacing $ with _. This small tweak lets Ddosify send requests with unpredictable variables. So, it's like mimicking different user behaviours and traffic scenarios for a comprehensive load test on your system. It helps us see how the system would fare in realistic, everyday situations.
Test Data Import
Ddosify allows you to import test data from various sources, such as CSV. This feature is particularly useful when you want to test your system with real-world data. For example, you can import a CSV file containing user details and use it to simulate a real user's behaviour on your system.
If you are working with a large dataset, you can use Ddosify's Test Data Import feature to import your data and use it in your test scenarios. This way, you can test your system with real-world data and get more accurate results. How to do it? You can check out the Testing the performance of a FinTech API blog post.
Environment Variables
Ddosify allows you to define environment variables that can be used in your test scenarios. This feature is particularly useful when you want to reuse the same value across multiple test scenarios. For example, you can define an environment variable for your API endpoint and use it in all your test scenarios. This way, if your API endpoint changes, you only need to update the environment variable, and all your test scenarios will automatically use the new value.
Correlation
Correlation is like creating a chain of events in testing. Let's say you're trying to test your login process. Here's how you can do it: First, you send a login request and get an authentication token from the response you get. Now, simply pop this token into following requests that you send. It's a bit like unlocking a door (the login request), then using the key (the token) in future doors (subsequent requests). This is a basic example of how Ddosify Correlation works. It links steps in testing just like links in a chain.
Assertion
Ddosify usually gives a thumbs up to a test step if it can send a request and get a response without any network glitches. However, things like status codes or the kind of content received aren't really taken into account when deciding whether or not a test passed. But, hey, that might not work for what you're testing. You might need to set your own rules for what counts as a pass or fail. That's where Ddosify Assertions come in.
With Ddosify’s user-friendly platform, you don't even need to be a code wizard to create your own testing rules. You can base your pass or fail criteria on a bunch of different factors, things like the status code, how long it takes to get a response, the size of the response, or even what’s in the response. And if you’re feeling a bit more crafty, you could even mix and match a couple of these rules to create a more sophisticated testing logic.
Debugging
So, you're getting ready to put your system through a load test. Now, the top tip here is to take your testing scenario for a test run itself. Think of it like a dress rehearsal before the main show. This is where Ddosify's debug feature comes in handy.
When you run the debug, it's like going through your testing scenario just once to see how things are working. And the cool thing is, it gives you the full picture. You actually see what information is being sent and received, including environment variables, test data, and all the variables captured at every step. It's like getting a sneak peek of the backstage before the performance!
You will not incur any charges for using Debug requests within the Ddosify Cloud platform.
Postman Import
Picture this. You've created a great Postman Collection, and you'd like to test out your API endpoints. Now, wouldn't it be great to bring all that work straight into the Ddosify Postman Import feature? Well, that's totally possible, my friend. Not only does it save you from the hassle of setting up endpoints again, but also brushes off that extra dust.
And there's more. Those Postman Environments you're so used to can come over to Ddosify, too! They slip right in as Environment Variables within the app. It's like moving into a new house but bringing all your favorite furniture with you!
If you're a Postman user, you can import your Postman Collection and Environment directly into Ddosify. This way, you can reuse your existing work and save time. How to do it? You can check out the A Comprehensive Guide to Using Postman Collections for Effective API Endpoint Load Testing blog post.
Conclusion
To wrap up, Valentine’s Day isn't just all hearts and flowers, it's also a major event for every eCommerce business out there. Your website needs to be at its best to ensure smitten shoppers have a seamless experience. That's where Ddosify steps in. With our help, you can prepare for that big rush, provide top-notch user experience, and jump over the Valentine's Day hurdle with finesse. When you do that, your business shines as a top choice for shoppers all around the globe. And when your customers are head-over-heels in love with your brand, you'll see it in your skyrocketing sales numbers. Happy Valentine's Day, folks!
Now, whether service deployment gets your heart racing or not, here are some Ddosify options to keep in mind: We've got Ddosify Self-Hosted, perfect for those who enjoy running things on their own terms. And if you prefer a life in the clouds, look no further than Ddosify Cloud option - we have everything fully managed and ready to go when you need it.
And don’t forget about our Discord community! It's a fantastic place to connect with our team and other users like you to share ideas, get your questions answered, and help us make Ddosify even more lovable. Here's the link: Discord channel. See you there!
Share on social media: