

Profiling is a process that helps you understand how your application performs and how it uses resources. It is a crucial step in the development process, as it allows you to identify performance bottlenecks and optimize your application. In this article, we will discuss how to profile a React application using the React Profiler tool.
In React version 16.5, a new DevTools profiler plugin has been introduced to enhance the development tools for React applications. This plugin utilizes React Dev Tools to gather timing data for each rendered component, aiding in the identification of performance bottlenecks within the application. Importantly, it is designed to seamlessly integrate with forthcoming features such as time slicing and suspense in React.
Profiling an application
Developers can use the React Profiler to record performance data for their applications. This data can then be used to identify performance bottlenecks and optimize the application. The React Profiler is available as a plugin for the React DevTools extension. It can be installed from the Chrome Web Store or the Firefox Add-ons site.
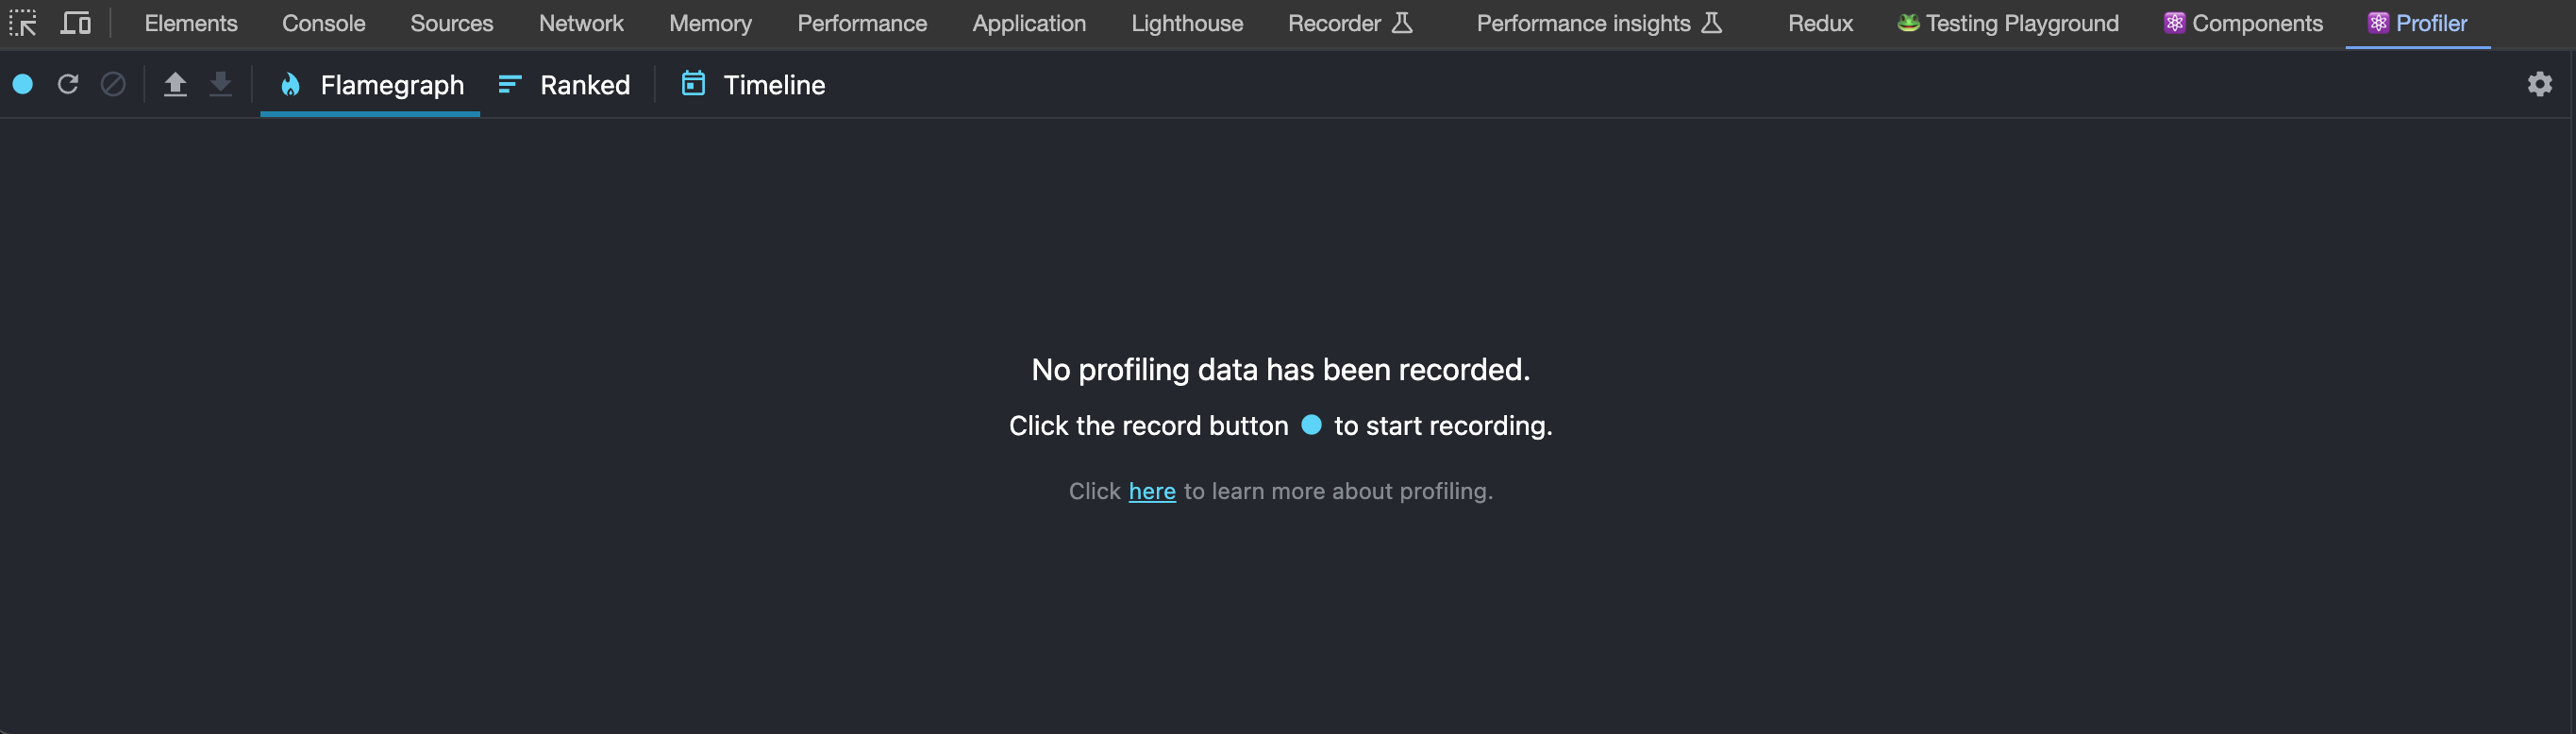
DevTools will automatically start recording performance data when you open the React Profiler. You can also manually start and stop recording performance data by clicking the "Start Profiling" and "Stop Profiling" buttons in the toolbar.
react-dom 16.5+ supports profiling in DEV mode. A production profiling bundle is also available as react-dom/profiling. Read more about how to use this bundle at fb.me/react-profiling.
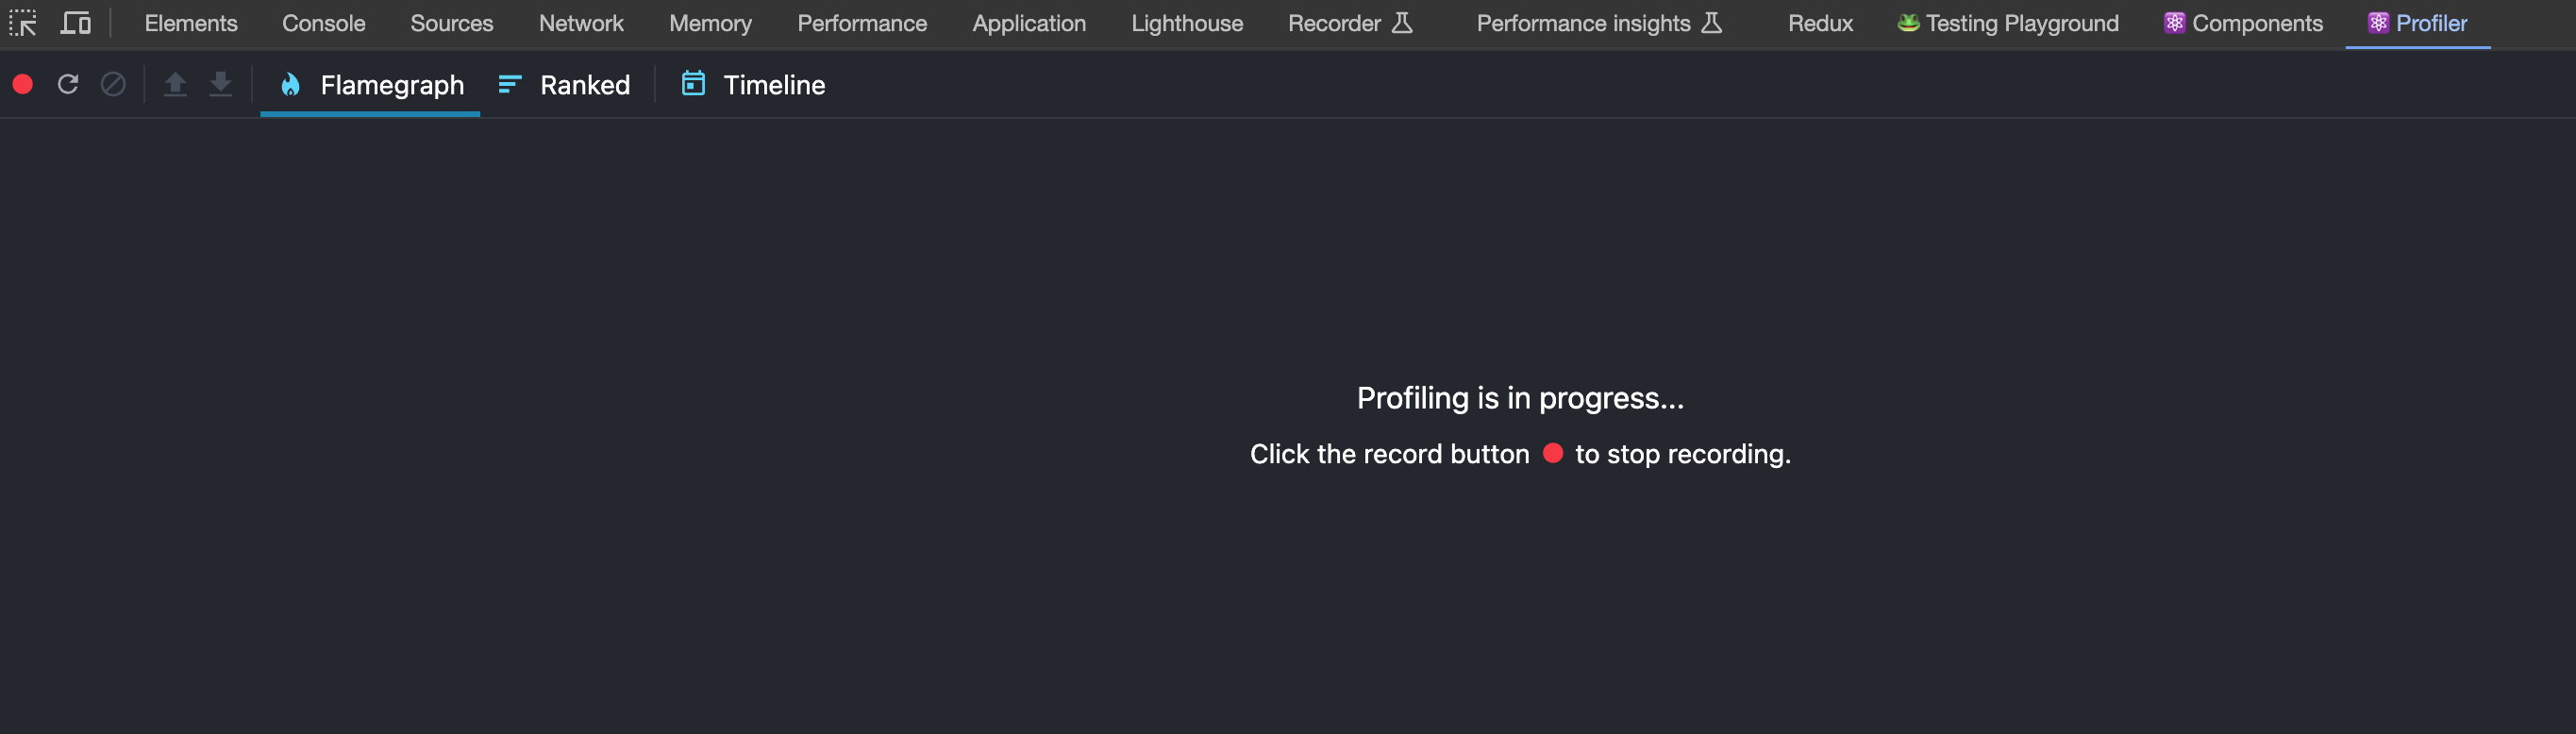
After initiating the recording process, DevTools will autonomously gather performance data on each instance of your application rendering. Continue using your app in the usual manner. When you're ready to conclude the profiling session, simply click the "Stop" button.
When you start recording performance data, DevTools will display a list of all the components that were rendered during the recording period. You can click on any component in the list to view its performance data.
If your application underwent at least one rendering during the profiling session, DevTools will present various methods for reviewing the performance data. The upcoming sections detail these different perspectives.
Reading performance data
Browsing commits
Conceptually, React does work in two phases:
In the
renderphase, the system identifies the necessary modifications to elements such as the DOM. In this stage, React invokes the render function and subsequently compares the outcome with the previous render.In the
commitphase, React implements any modifications, such as inserting, updating, or removing DOM nodes in the case of React DOM. Additionally, React invokes lifecycles likecomponentDidMountandcomponentDidUpdateduring this stage.
The performance information in the DevTools profiler is organized based on commits. A bar chart representing these commits is showcased near the top of the profiler.

Every bar in the chart corresponds to an individual commit, with the presently chosen commit highlighted in black. To choose an alternative commit, you can click on a bar or use the left/right arrow buttons.
The color and height of each bar indicate the duration it took for that specific commit to render. A taller, yellow bar signifies a longer rendering time, while a shorter, blue bar suggests a shorter rendering duration.
Filtering commits
The more you engage in profiling, the greater the frequency of your application renders. In certain scenarios, you might accumulate a considerable number of commits that could become challenging to analyze. The profiler provides a filtering mechanism to address this issue. By setting a threshold, you can instruct the profiler to conceal commits that completed faster than the specified value.
Flame chart
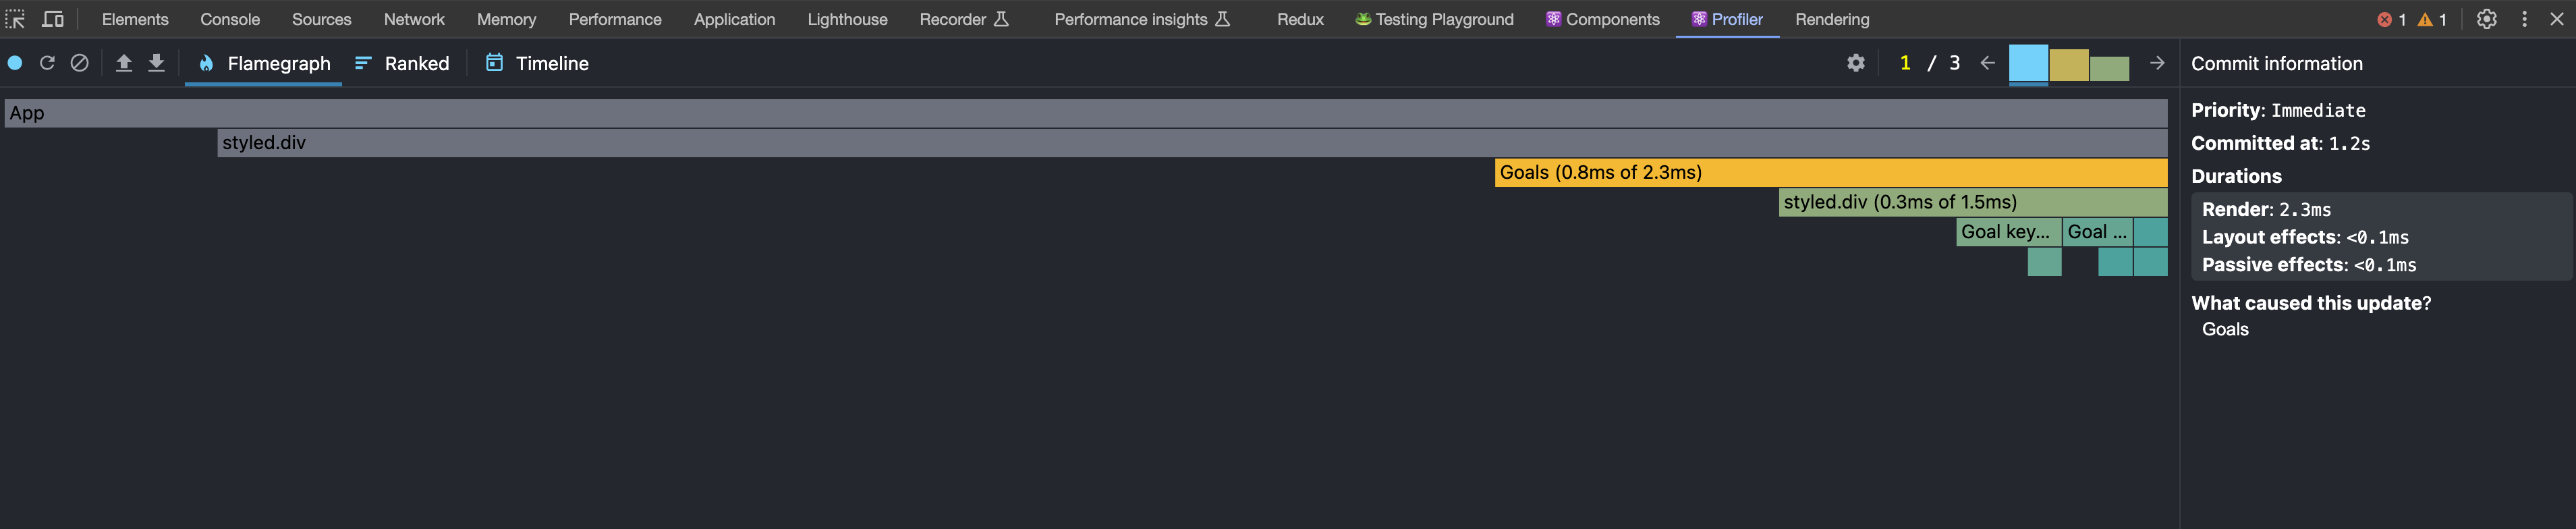
The flame chart view illustrates the condition of your application during a specific commit. Each bar in the chart symbolizes a React component, such as App, Goals, or Goal. The dimensions and color of each bar signify the rendering duration of the component and its nested elements. The width of a bar indicates the time spent during the component's last rendering, while the color reflects the time spent in the current commit.
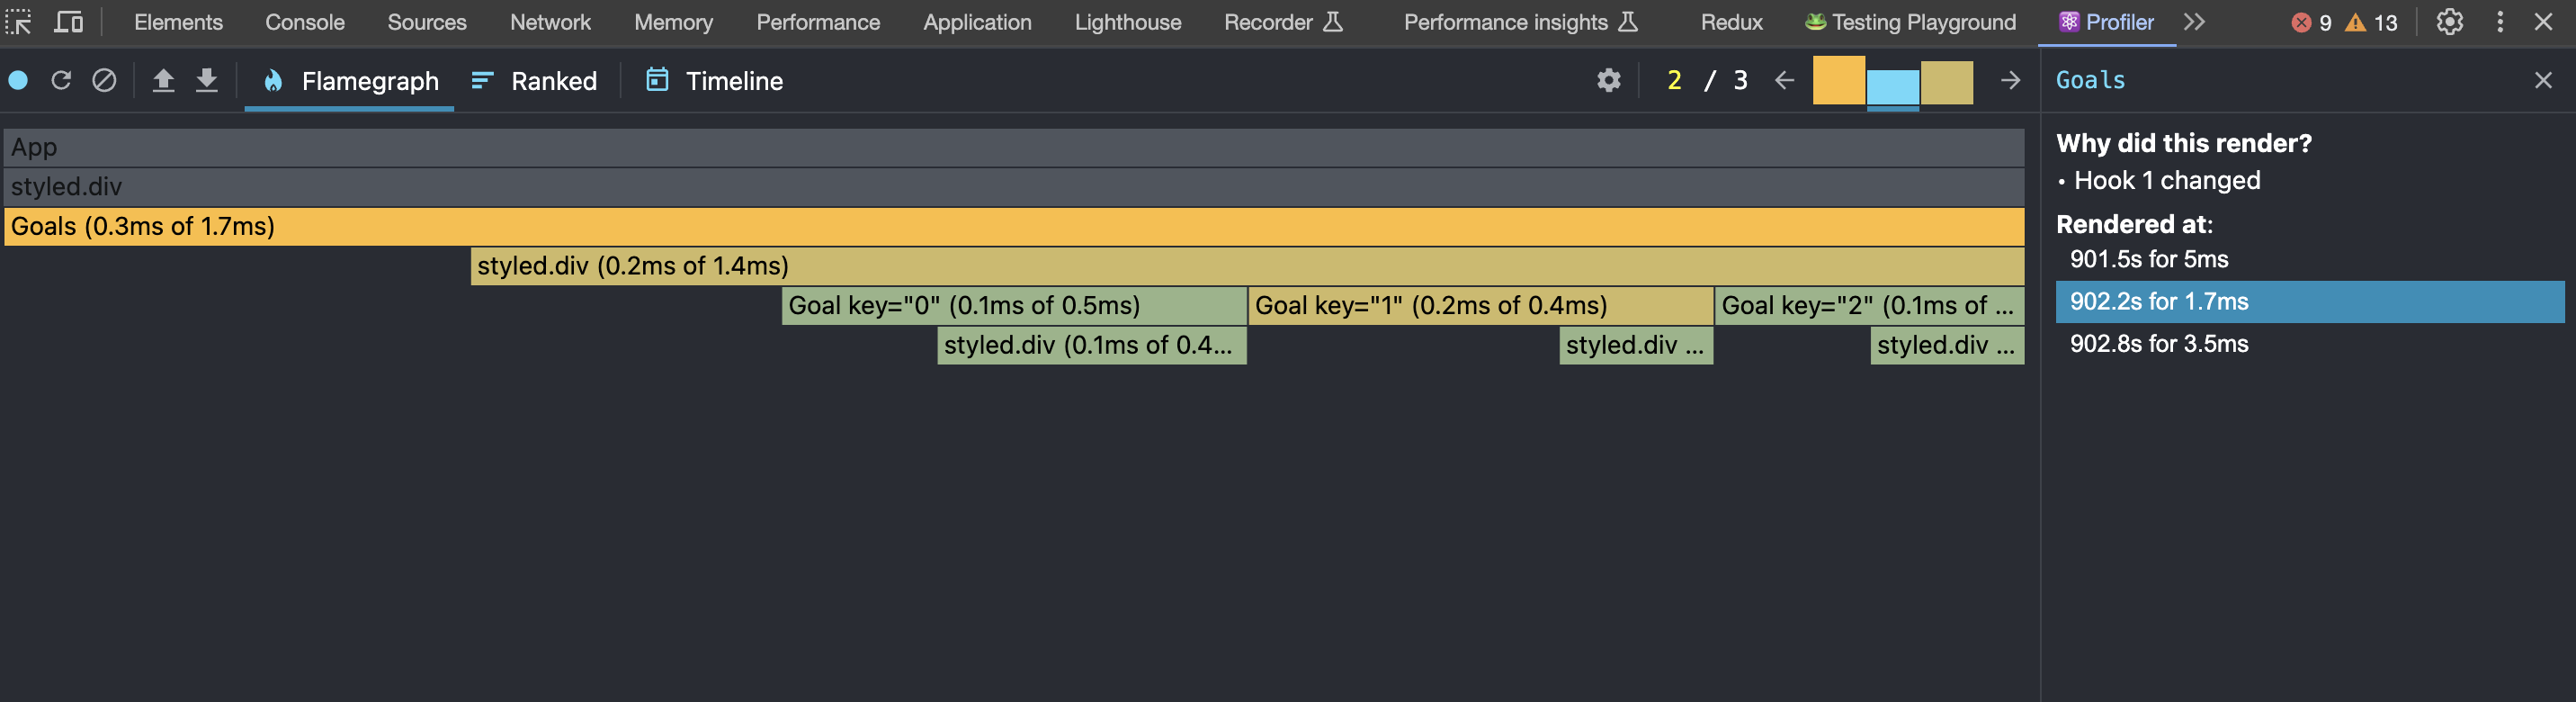
The breadth of a bar signifies the duration it took to render the component and its children in their most recent rendering. If the component did not undergo a re-render in the current commit, the time reflects a previous rendering. A wider bar indicates a longer rendering time.
The color of a bar denotes the time taken for the component and its children to render in the chosen commit. Yellow components consumed more time, blue components required less time, and gray components did not undergo rendering at all in this commit.
For example, the commit shown above took a total of 5ms to render. The Goals component was the “most expensive” to render (taking 5ms). Most of this time was due to its children, styled-div (3.4ms). The rest of the time was divided between its remaining children or spent in the component’s own render method.
You can zoom in or out on a flame chart by clicking on components:
Clicking on a Component Dev Tool tab find to select a same component name and show information in the right side panel which includes its props and state at the time of this commit. You can drill into these to learn more about what the component actually rendered during the commit:
In certain scenarios, choosing a component and navigating through different commits may offer insights into the reasons behind the component's rendering:
The above image shows that state.isDone changed between commits. This is likely what caused the Goal component to re-render.
Ranked chart
The ranked chart view represents a single commit. Each bar in the chart represents a React component (e.g. App, Goals). The chart is ordered so that the components which took the longest to render are at the top.
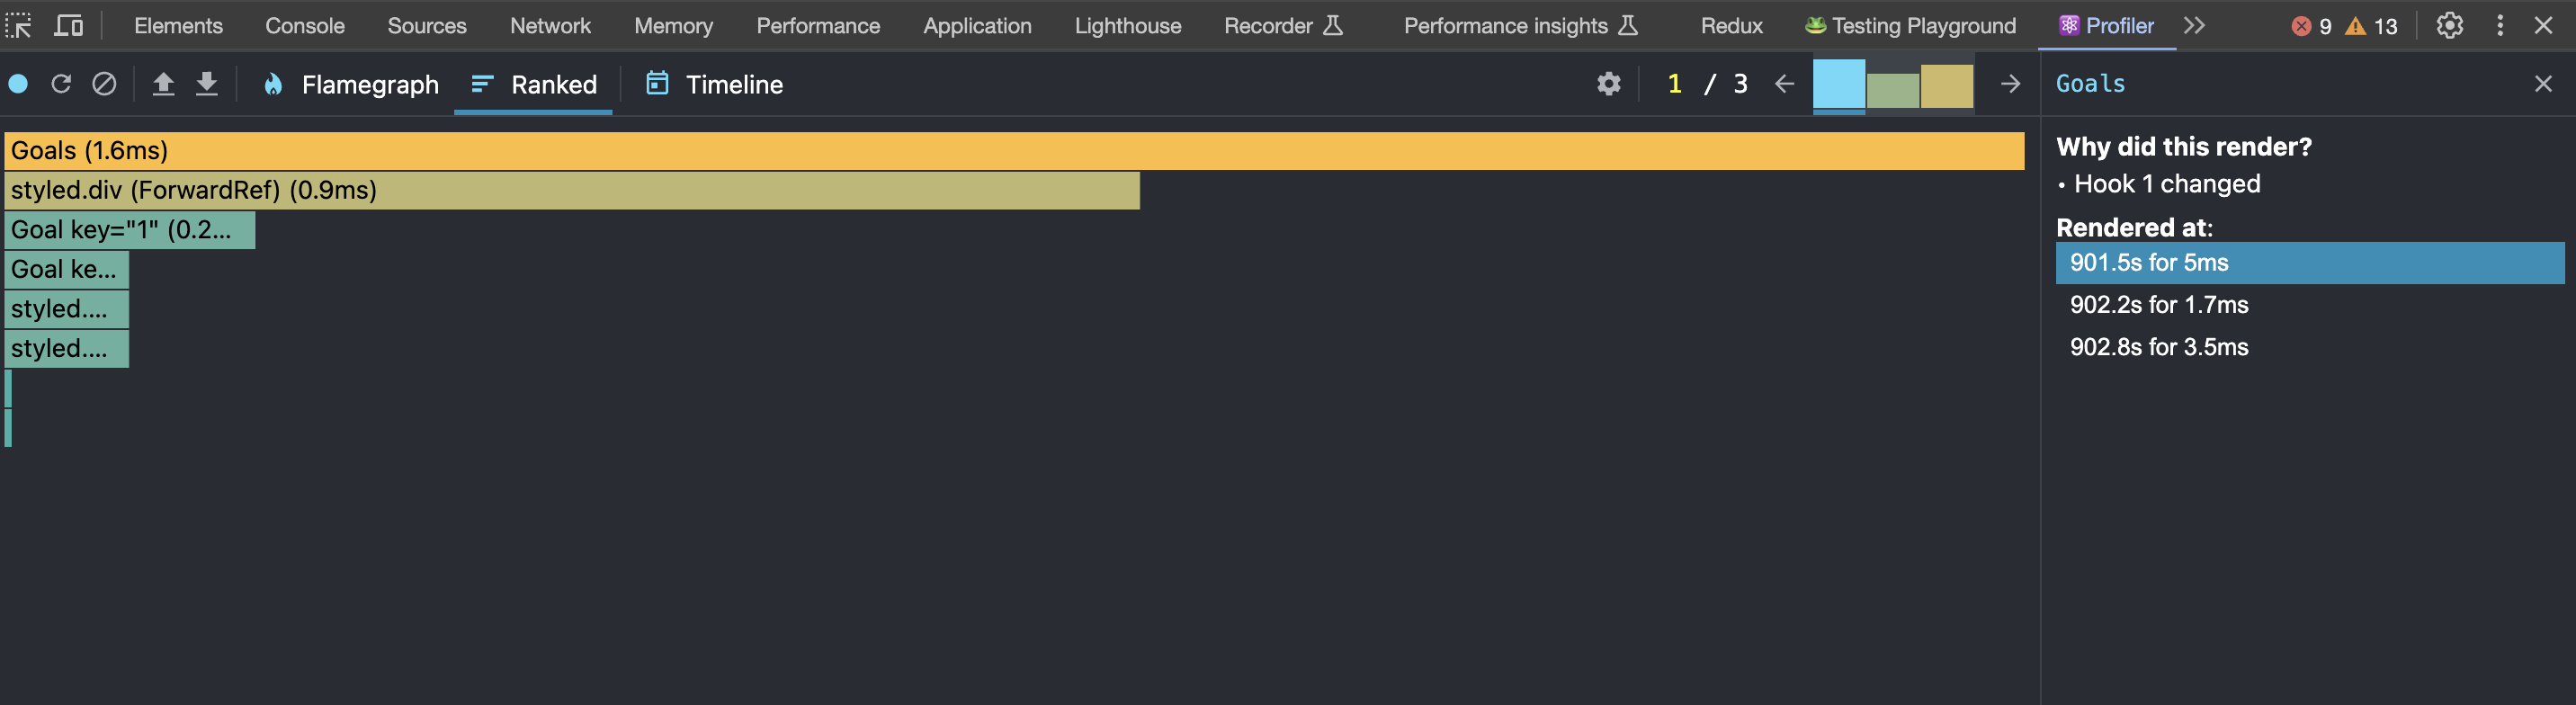
The rendering time of a component encompasses the time dedicated to rendering its children. As a result, components that exhibit lengthier rendering times are typically positioned closer to the top of the component tree.
Similar to the flame chart, you have the ability to zoom in or out on a ranked chart by clicking on components.
Cause of re-rendering
Now that the component has been re-rendered, the subsequent question arises: why?
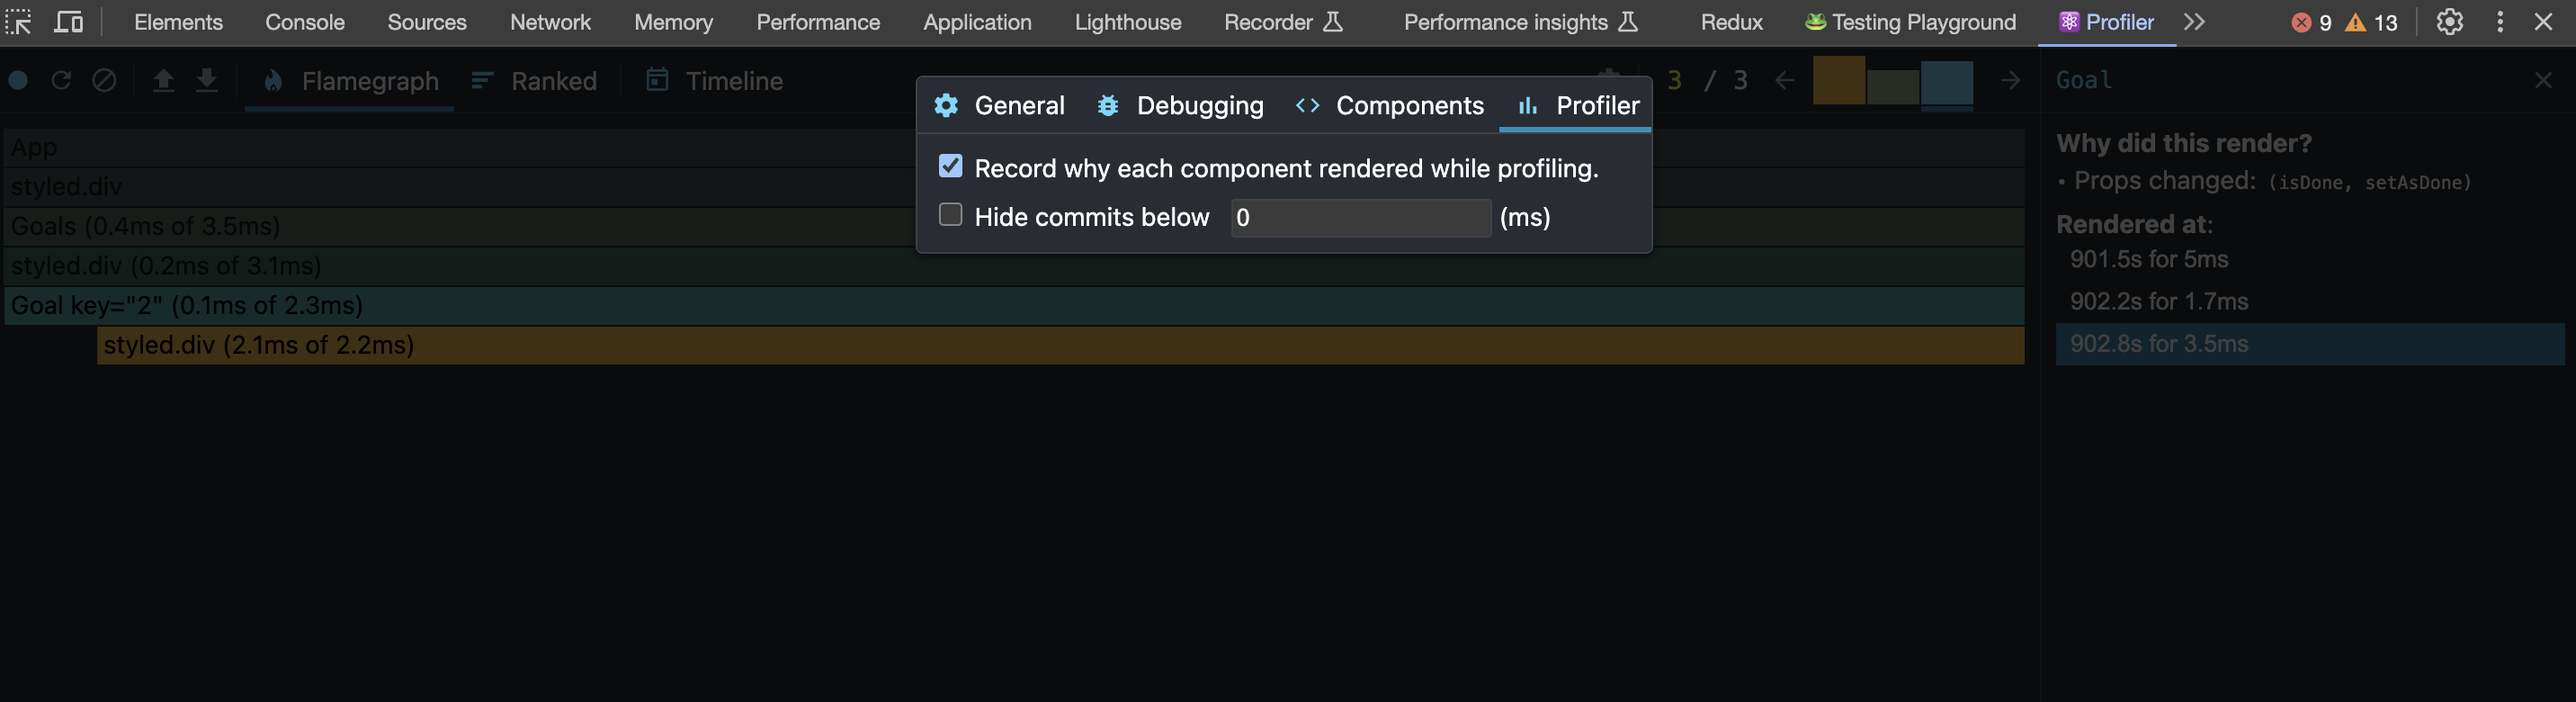
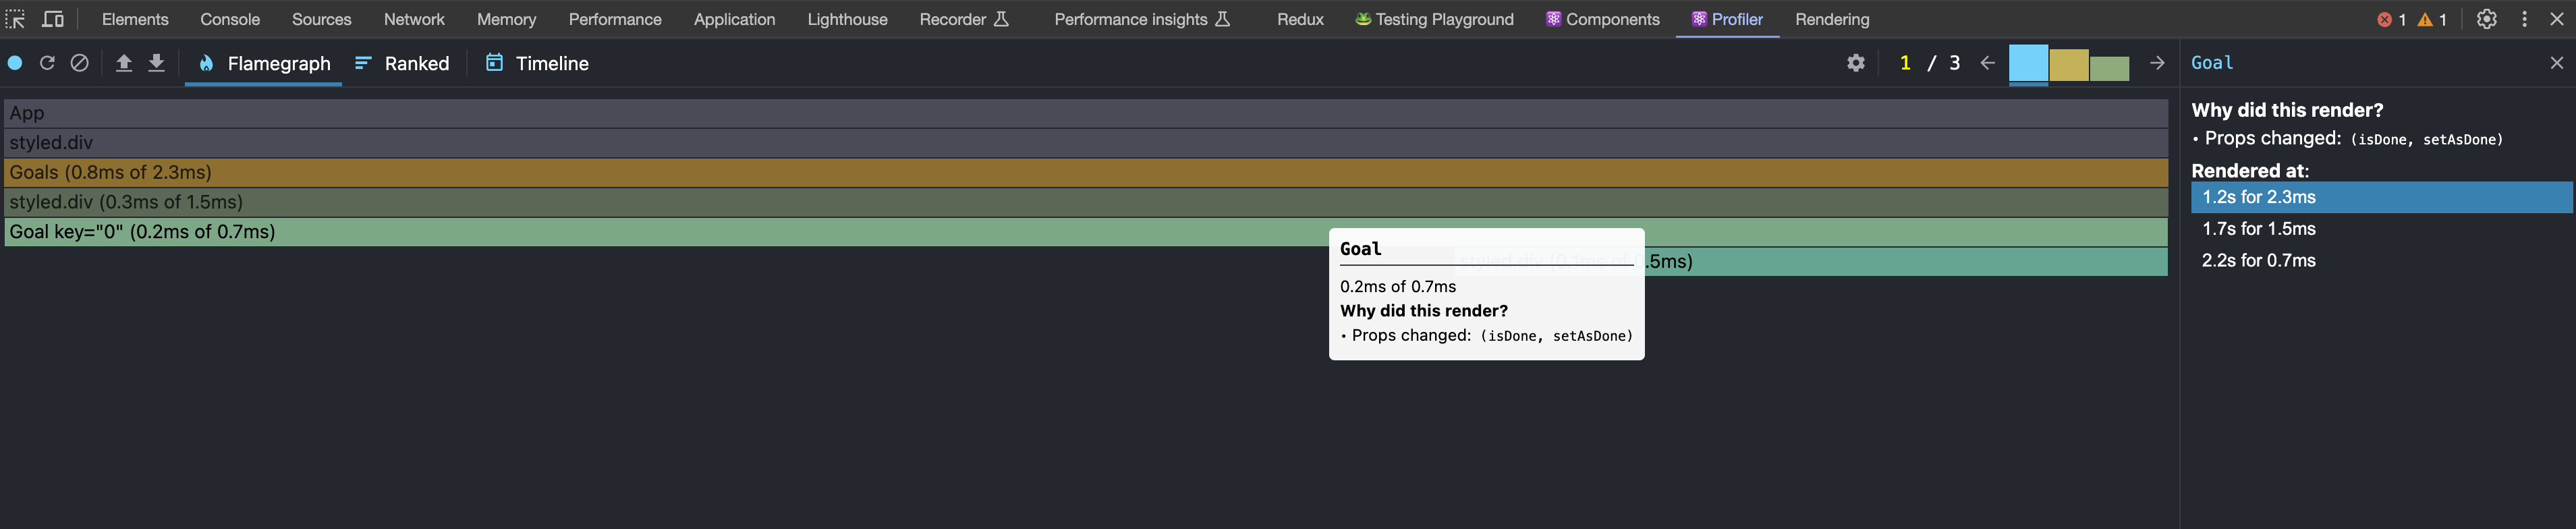
A useful tooltip appears when you hover over a component in the "Flamegraph," providing information on the reason for the render under the "Why did this render?" section.
Here's a breakdown of how to interpret the profiler output:
Number of React Commits
Located in the top right, this figure indicates the count of React commits. Each bar in the chart represents a moment when the React component tree underwent a change, and a corresponding update was committed to the DOM.
Flamegraph
The "Flamegraph" visually represents the component tree, highlighting changes. Components marked in "grey" indicate that they did not undergo a rerender. Hovering over each component reveals the reason for its rendering, available under the "Why did this render?" subheading.
Possible Reasons for Rerendering
The following are potential reasons for a component rerender:
- "This is the first time the component rendered."
- "Context changed"
- "Hooks changed"
- "Props changed"
- "State changed"
- "The parent component rendered."
Occasionally, the reason provided may lack detailed information, such as simply stating "hook changed" without specifying the particular hook that changed. This is expected, as DevTools may not always have access to such detailed information, or retrieving it might be too slow.
Clicking a Component in the Flamegraph
When you click on a component in the "Flamegraph," the right sidebar updates to display all renders of that specific component instance and the reasons behind each rendering.
Bonus tip: See at a glance what components took the longest to render
The colors within the "Flamegraph" hold significance: "cool" colors, such as various shades of blue, indicate that the component required minimal rendering time compared to other elements. Conversely, "warm" colors, such as orange and red, signify that the component had a lengthier rendering duration.
Troubleshooting
No profiling data has been recorded for the selected root
If your application contains multiple "roots," you might encounter the following message post-profiling:
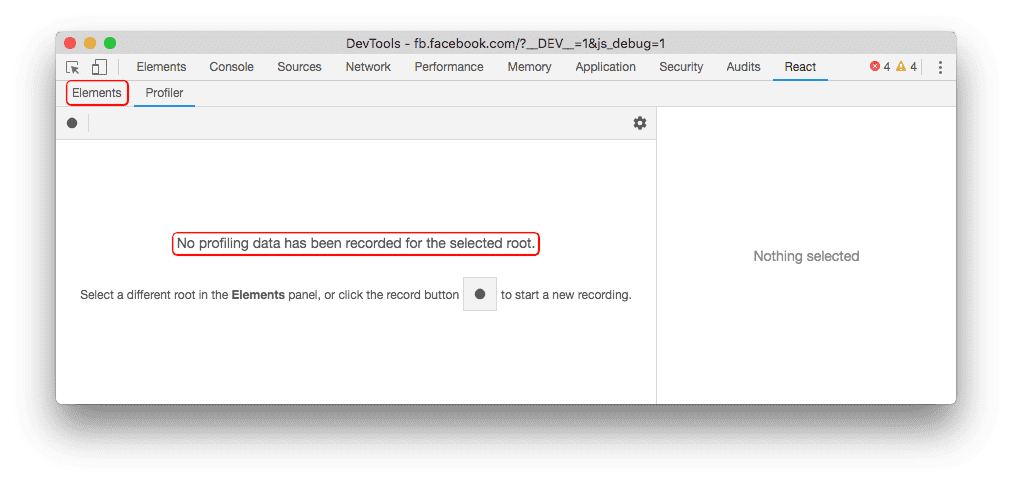
"No profiling data has been recorded for the selected root." This message signifies the absence of recorded performance data for the currently chosen root in the "Elements" panel. In such instances, consider selecting an alternative root in that panel to access profiling information for the desired root:
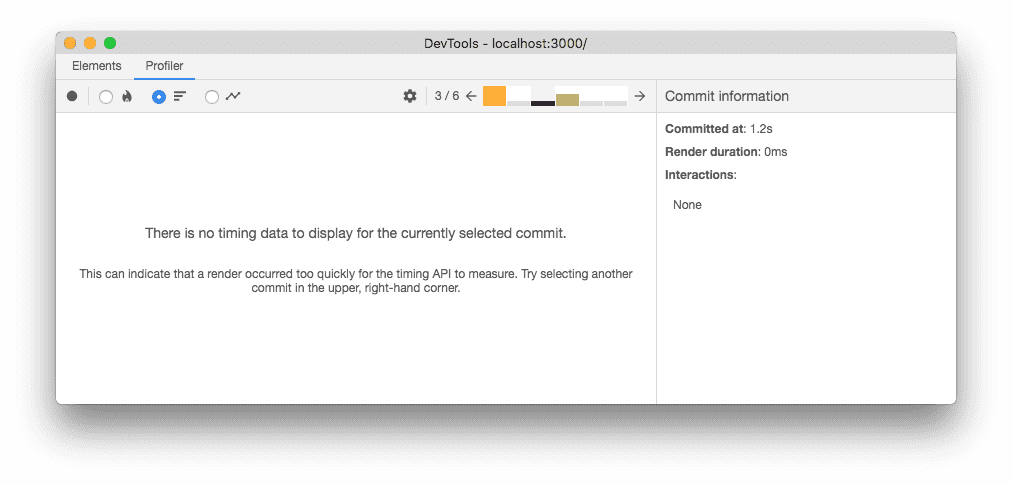
No timing data to display for the selected commit
At times, a commit may be executed so quickly that performance.now() fails to provide meaningful timing information for DevTools. In such instances, the following message will be displayed:
Conclusion
In summary, the React Profiler stands as a robust tool enabling developers to troubleshoot and enhance the performance of their React applications. By offering a comprehensive analysis of individual component performance, the profiler empowers developers to pinpoint and resolve performance bottlenecks, ultimately enhancing the overall efficiency of their applications.
Whether you're engaged in a modest personal project or tackling a substantial enterprise application, the React Profiler proves valuable in creating applications that are faster, more responsive, and user-friendly.
Share on social media: