

Introduction
Welcome to the first blog post of our series “Prometheus 101”, where we dive into the world of Prometheus, a game-changing tool in the realm of software monitoring and alerting. Whether you are a seasoned DevOps professional or a software engineer keen to enhance the reliability and performance of your applications, understanding Prometheus is essential in today's technology landscape.
In this post, we will introduce you to Prometheus, a robust open-source system that has transformed how organizations monitor their IT infrastructure and applications. Developed initially by SoundCloud and now part of the Cloud Native Computing Foundation, Prometheus has gained immense popularity for its simplicity, efficiency, and suitability in dynamic, microservices-based architectures.
What is Prometheus?
Prometheus is an observability tool that allows you to monitor the health and performance of software systems.
Prometheus:
- Collects and stores metrics as time series data, meaning each data point is stored with its timestamp. It also allows the storage of multi-dimensional metrics, meaning the timeseries data could be queried by metric name and key/value pairs.
- Provides a convenient query language named PromQL so you can execute more complex queries for getting the insights you require.
- Allows for setting up alerts and getting notified when a specific condition occurs. You can also set up email, Slack and Pagerduty integrations for these.
- It also supports service discovery in environments like Kubernetes and Amazon EC2 so that it allows you to monitor your system dynamically.
What is Prometheus Not?
While Prometheus is a powerful tool, it's helpful to know its limitations and when to use other tools for different tasks.
Prometheus is:
- Not suitable for logging and event management. If you are more interested in these, you can check out Elasticsearch, Logstash, Kibana, and Splunk instead.
- Not a data storage solution. While it stores time series data, it's not a replacement for traditional databases. Its primary function is monitoring, not long-term data storage.
- Not an APM (Application Performance Management) Tool. Although it can be used to monitor application performance to some extent, it doesn't offer deep application performance insights like APM tools (e.g., New Relic, Dynatrace).
- Not Natively Clustered. Prometheus does not natively support clustering for scalability or redundancy. However, it can be integrated with other tools or set up in a high-availability configuration.
- Not 100% accurate. Since Prometheus values reliability more than accuracy, it is not suitable for cases where each timeseries data needs to be stored and retrieved the way it exactly is.
Architecture
Here is the architecture of Prometheus:
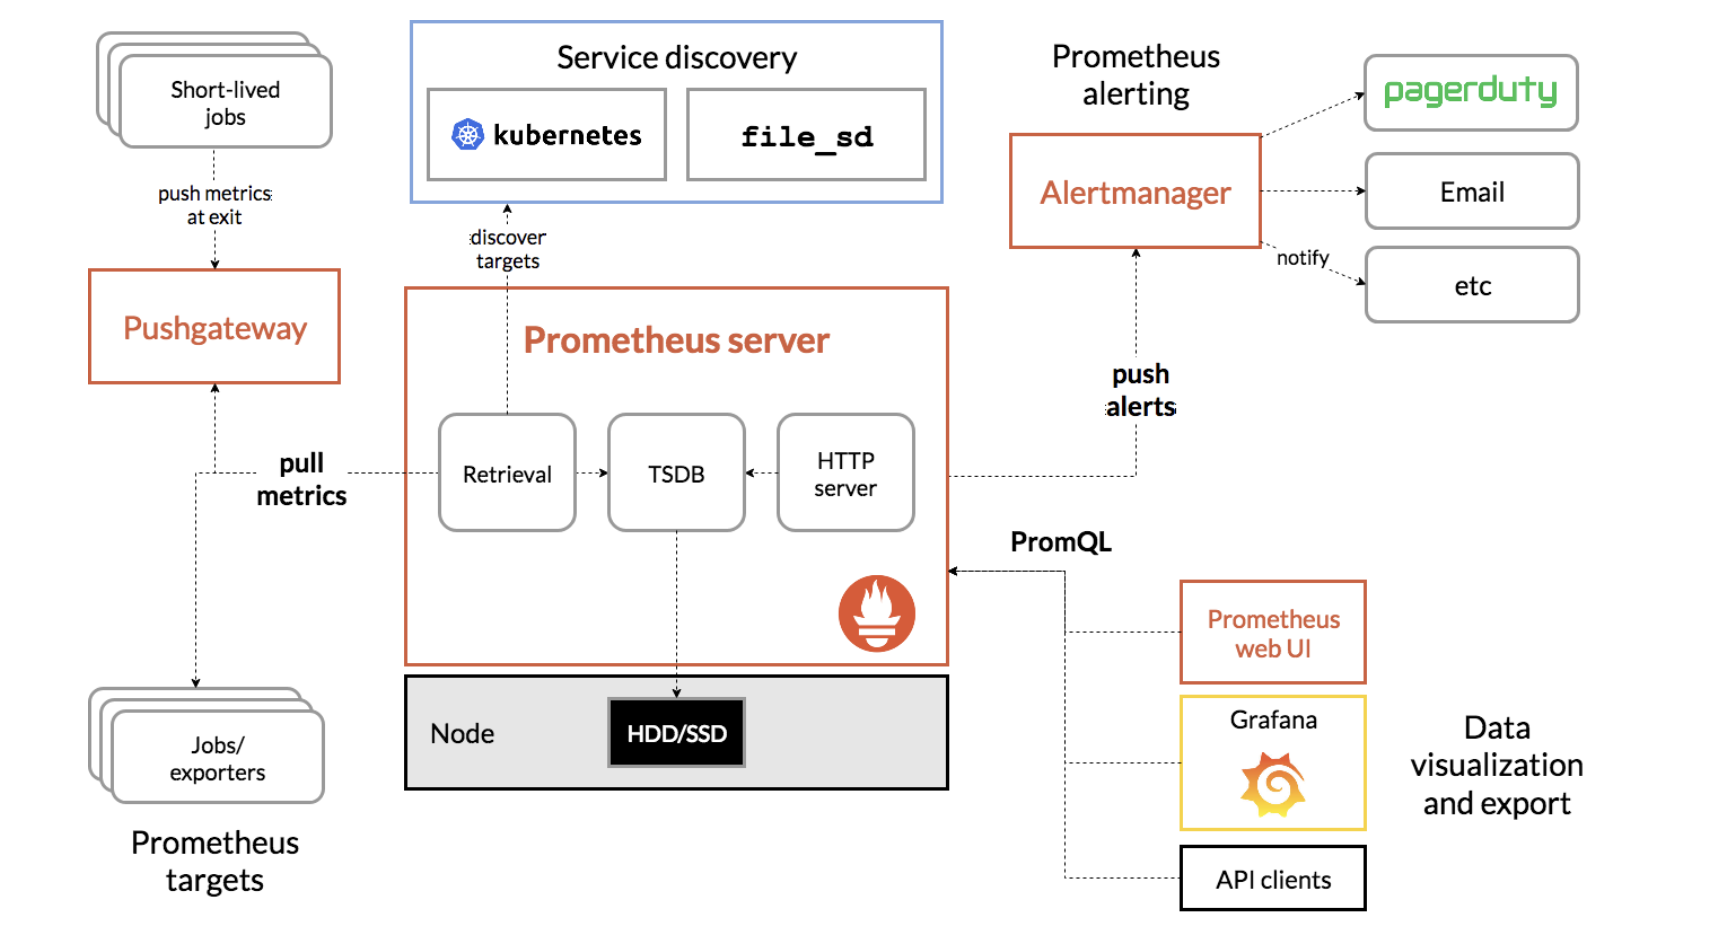
Let’s explain some of the components and keywords and what they mean:
Target: In Prometheus, a “target” refers to an instance that is being monitored. This could be a single server, a database, a service, or any other component that exposes metrics in a format that Prometheus can scrape.
Each target exposes a URL for Prometheus to scrape. Prometheus then periodically sends requests to these URLs to scrape metric data and stores them.
Job: Job refers to a group of similar targets. An example for this could be a series of instances where the same application is deployed. Then, Prometheus scrapes data from all of these instances through a single job.
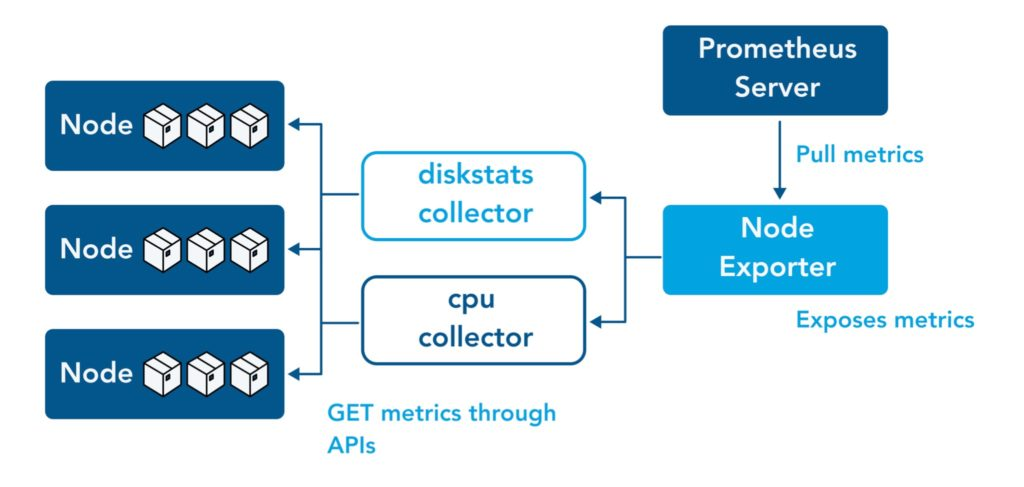
Exporter: Exporters allow existing systems to expose their metrics in a Prometheus-compatible way. They act as intermediaries between the systems and Prometheus.
There are many official and community-developed exporters available for a wide range of common services and systems (like databases, hardware, HTTP services, etc.).
Exporters can either translate existing metrics into the Prometheus format or generate new metrics from a third-party system.
Pushgateway: Pushgateway allows temporary or short-lived jobs to expose data to Prometheus. Since these jobs die out after a time, they are not able to expose a URL for Prometheus to scrape. However, if they send these data to Pushgateway instead, it stores all of these data and exposes them itself.
For more information about the Prometheus architecture, you can visit here.
Now that we know what Prometheus is and how it operates, let’s set it up ourselves and monitor an example application.
Setting Up a Docker Network
As a prerequisite for following along, make sure you have Docker installed. Then, we need to create a Docker network for our demo to work properly. Execute this to do so:
docker network create prometheus-demo
If you are not using Docker, you can alternatively install the sample app (NodeExporter) and Prometheus by using their installation instructions. In that case, you need to use localhost instead of the container name as Prometheus scrape url domain.
Now that this is done, let’s deploy a sample application and use Prometheus to monitor it.
Setting Up NodeExporter
First, we need to set up an application to monitor. For this purpose, we can use NodeExporter which is developed and maintained by Prometheus. This application exports the data of the node it is deployed on in a format that Prometheus understands. We will set it up using Docker. To do so, run:
docker pull prom/node-exporter
docker run -d -p 9100:9100 \
        --net prometheus-demo \
        --name=node_exporter \
        prom/node-exporter
After this, you should be able to visit localhost:9100 to see this:
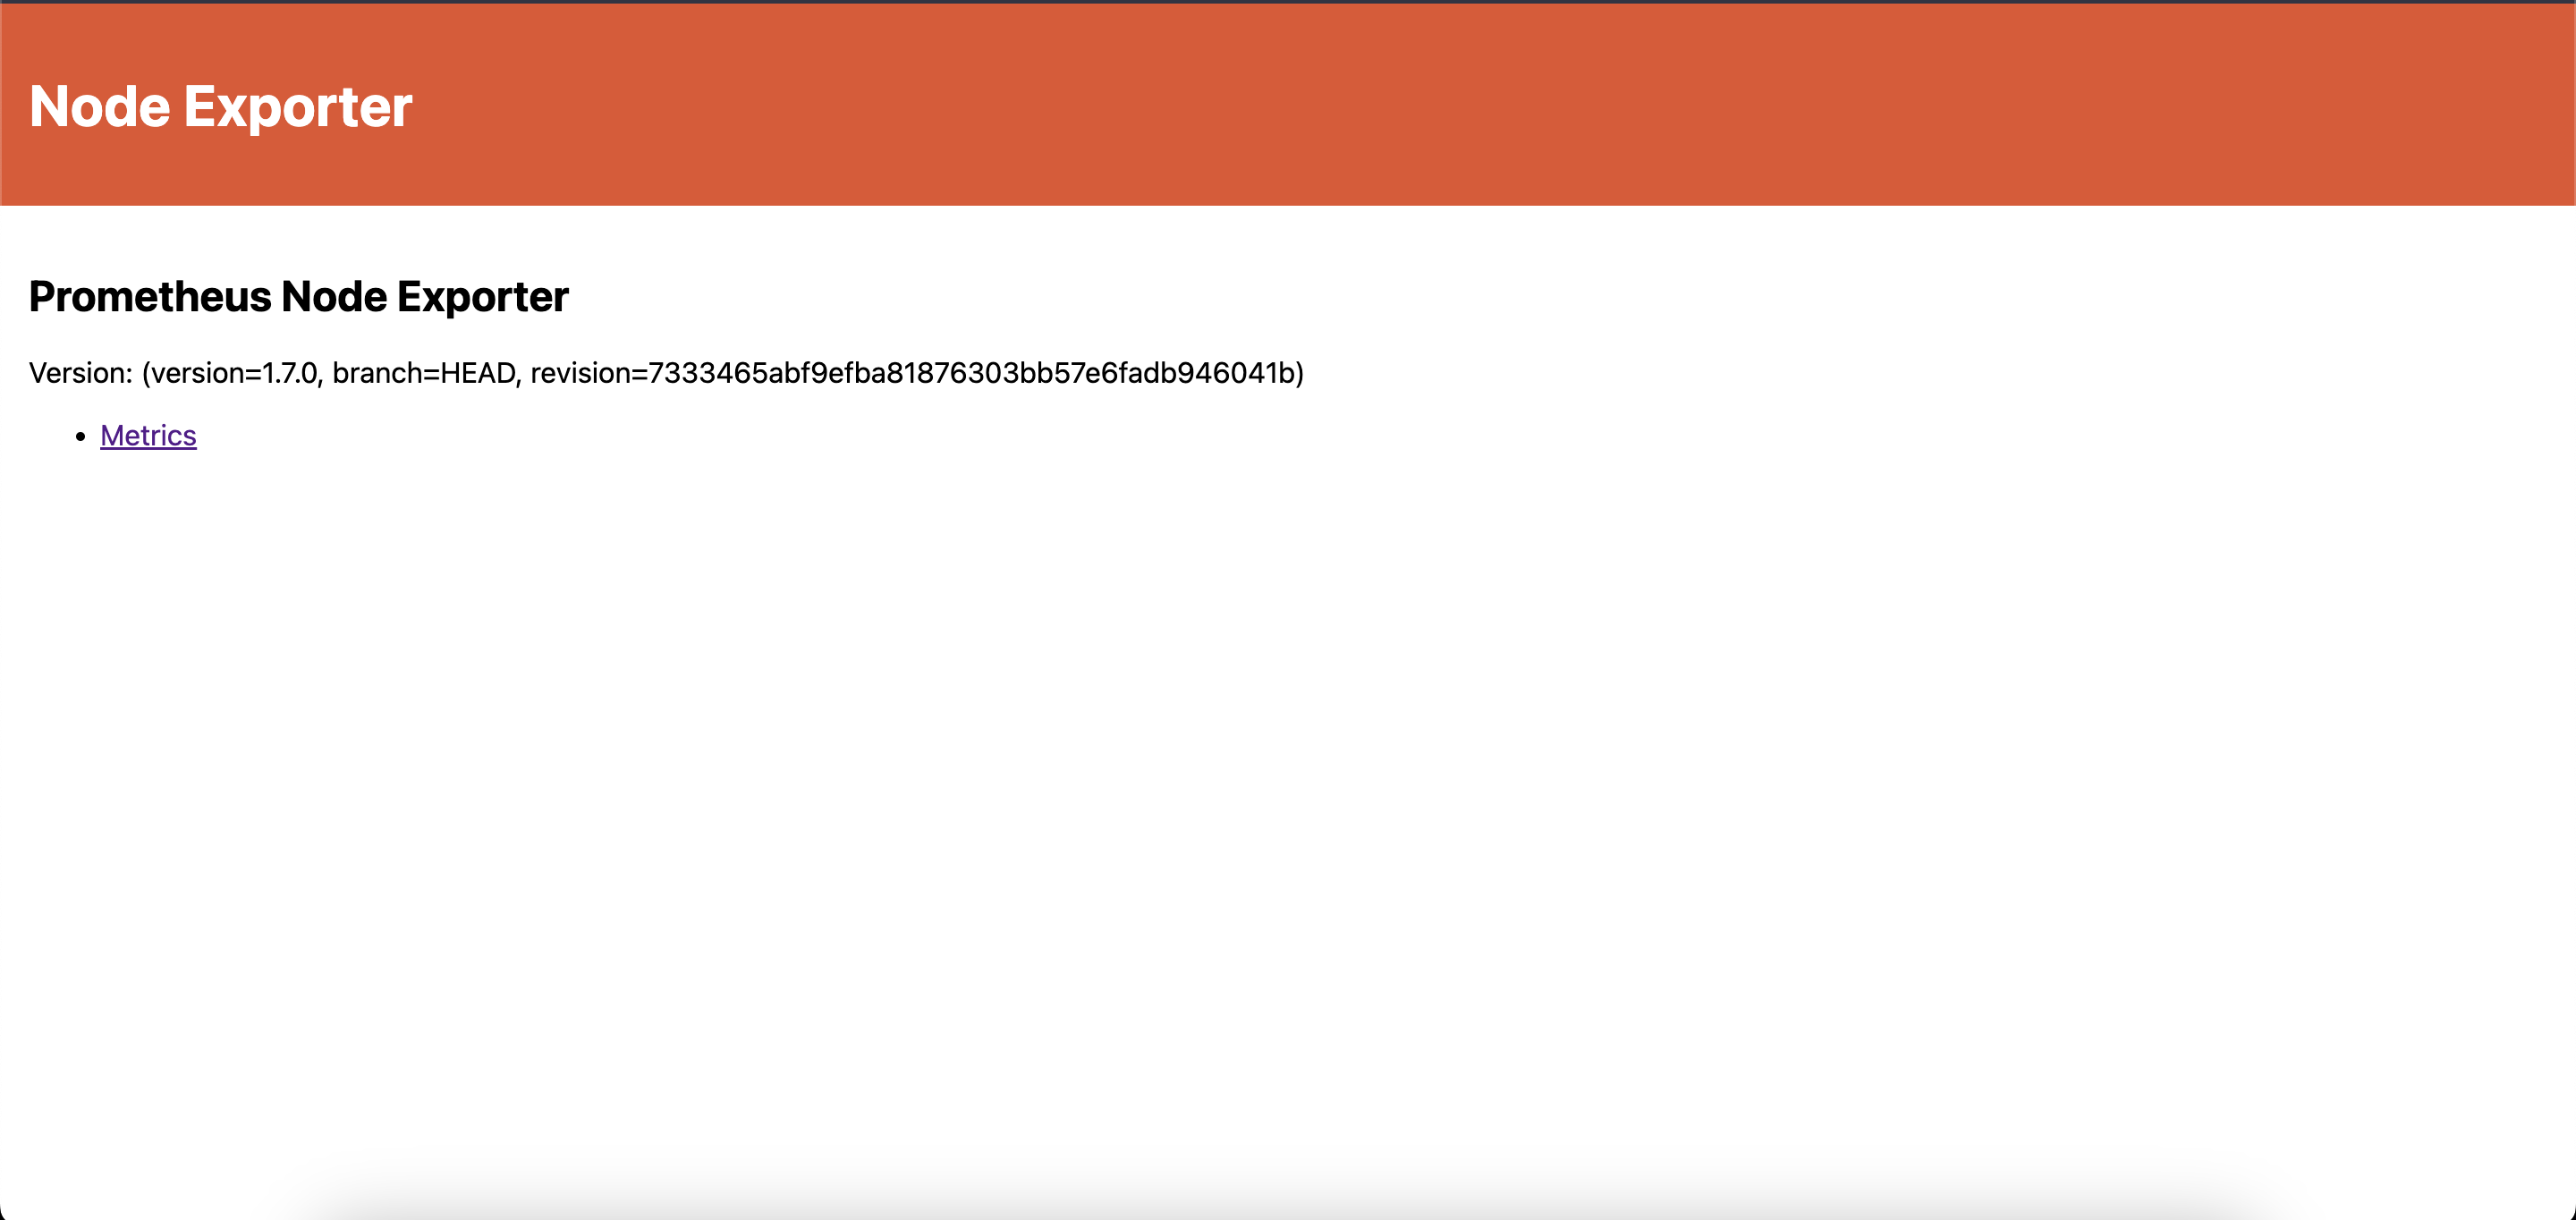
If you click on “Metrics”, you will see this:
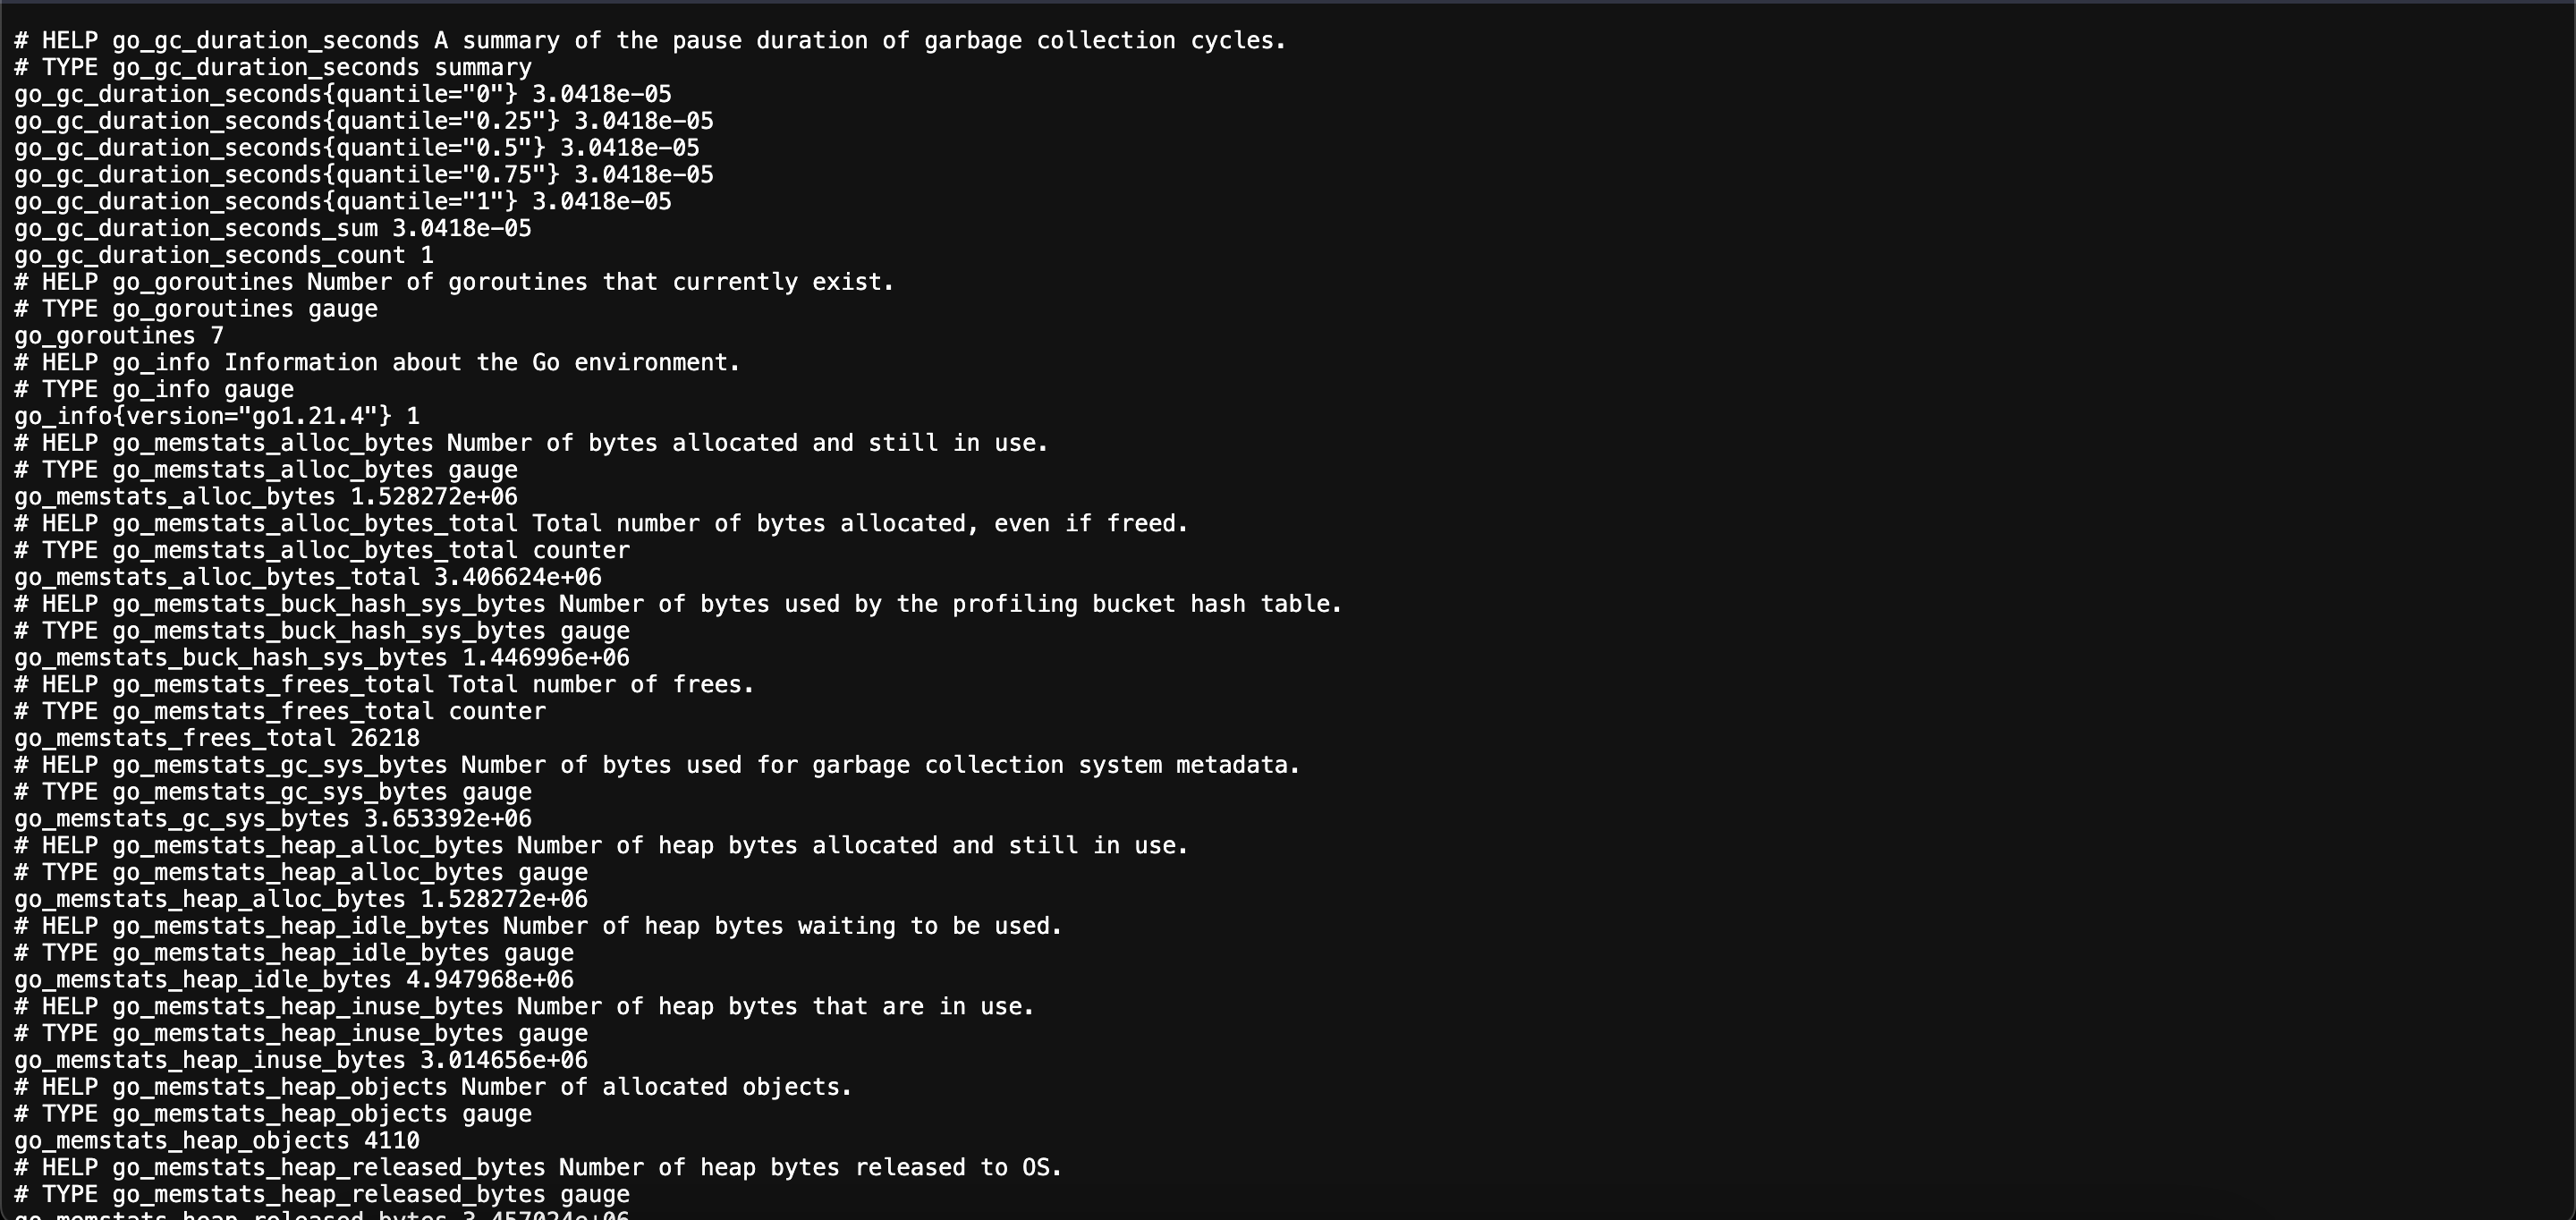
This shows us that NodeExporter successfully receives data from its node and serves it on http://localhost:9100/metrics.
Setting Up Prometheus
Now that we have our metrics, we can set Prometheus up to scrape it.
You can do so in different ways such as installing it directly or using Docker. Here, we will use Docker. But first, we need to create a prometheus configuration file called prometheus.yml.
Prometheus Configuration
global:
  scrape_interval: 15s
  evaluation_interval: 15s

rule_files:
  # - "first.rules"
  # - "second.rules"

scrape_configs:
  - job_name: prometheus
    static_configs:
      - targets: ["localhost:9090"]
This is the default Prometheus configuration file. You can edit this for your requirements. Let’s see what each section means:
global Defines the global settings for the Prometheus instance. Here, you can set settings such as
- scrape_interval: How frequent Prometheus should scrape its targets. Here it is set to 15 seconds.
- evaluation_interval: How frequent Prometheus should evaluate the timeseries data it is given and the alerts defined.
- external_labels: What labels to add the data it provides to external systems.
rule_files: Specifies the location of the rule files that Prometheus should load. Rule files contain the logic for alerting and recording rules. Since we won’t cover it right now, we can leave this part as it is.
scrape_configs: Defines where Prometheus should scrape metrics data from. Here, you can define multiple jobs for scraping different systems and applications. You can also scrape multiple targets in a single job. Here is an example of scrape_configs:
prometheus.yaml.examplescrape_configs:
- job_name: "node_exporter_metrics"
scrape_interval: 15s
scrape_timeout: 10s
static_configs:
- targets: ["localhost:9100", "localhost:9200"]
labels:
group: "production_servers"
- job_name: "database_metrics"
scrape_interval: 30s
metrics_path: "/metrics"
scheme: "https"
basic_auth:
username: "dbuser"
password: "dbpassword"
static_configs:
- targets: ["dbserver.local:9090"]
Here, let’s see how each job is configured:
node_exporter_metrics- scrape_interval: The targets (there is one in this case) under this job will be scraped every 15 seconds.
- scrape_timeout: The scrape requests sent to the targets have a timeout of 10 seconds. If no response is received during this time, the scrape will be set as failed.
- static_configs:
- targets: Prometheus will hit these URLs to scrape metrics data. In this case, it hits the ports
9100and9200of the domainlocalhost. - labels: These labels are added to the timeseries data received from the target they are defined under. In this example, the
{”group”: “production_servers”}label is added.
- targets: Prometheus will hit these URLs to scrape metrics data. In this case, it hits the ports
database_metrics- scrape_interval: The targets under this job will be scraped every 30 seconds.
- metrics_path: This path in the given targets will be hit. This is useful if you expose a certain endpoint for exporting data to Prometheus in your applications.
- scheme: Specifies the web protocol used to hit the endpoint.
- basic_auth: Specifies which username and password should be used for authentication while hitting the given endpoints of the given targets.
- static_configs:
- targets: Prometheus will hit the target in the domain
dbserver.local:9090while looking for metrics data.
- targets: Prometheus will hit the target in the domain
You can also configure the following in prometheus.yml (that we will not cover now):
- alerting: Defines the alert manager configuration.
- remote_write: Configurations for writing data to a remote storage.
- remote_read: Configurations for reading data from a remote storage.
- storage: Configurations related to the storage of the time series data. You can specify data retention period here.
- service_discovery: Specifies how Prometheus can discover targets dynamically.
Most of these fields are optional and if left blank, Prometheus uses default values for them.
For more information about configuring prometheus.yml, you can check here.
With these in mind, create a file named prometheus.yml and paste this in it (If you want Prometheus to monitor itself, you can also add ‘localhost:9090’ next to ‘node_exporter:9100’):
global:
  scrape_interval: 15s
  evaluation_interval: 15s

scrape_configs:
  - job_name: node_exporter
    metrics_path: "/metrics"
    static_configs:
      - targets: ["node_exporter:9100"]
Note: Creating a Docker network allows us to send requests from one container (Prometheus in this case) to another container (NodeExporter in this case) by only using its name as a domain. If we had not done it, we would have needed to provide the IP address of the NodeExporter container in prometheus.yaml as the target.
Deploying Prometheus as a Container
After saving this file, we can run Prometheus on a Docker container using this configuration. To do so, run the following command (make sure to replace /path/to/prometheus.yml with the path of prometheus.yml you just configured):
docker volume create prometheus-data
docker run \
    -p 9090:9090 \
    -v /path/to/prometheus.yml:/etc/prometheus/prometheus.yml \
    -v prometheus-data:/prometheus \
        --net prometheus-demo \
    --name prometheus \
    prom/prometheus
What these commands do is that
- It first creates a persistent volume for the Prometheus data. This helps to preserve the data in cases of container failure or removal.
- Then sets Prometheus up in port
9090using this persistent volume and the yaml file provided.
Verifying the Metrics
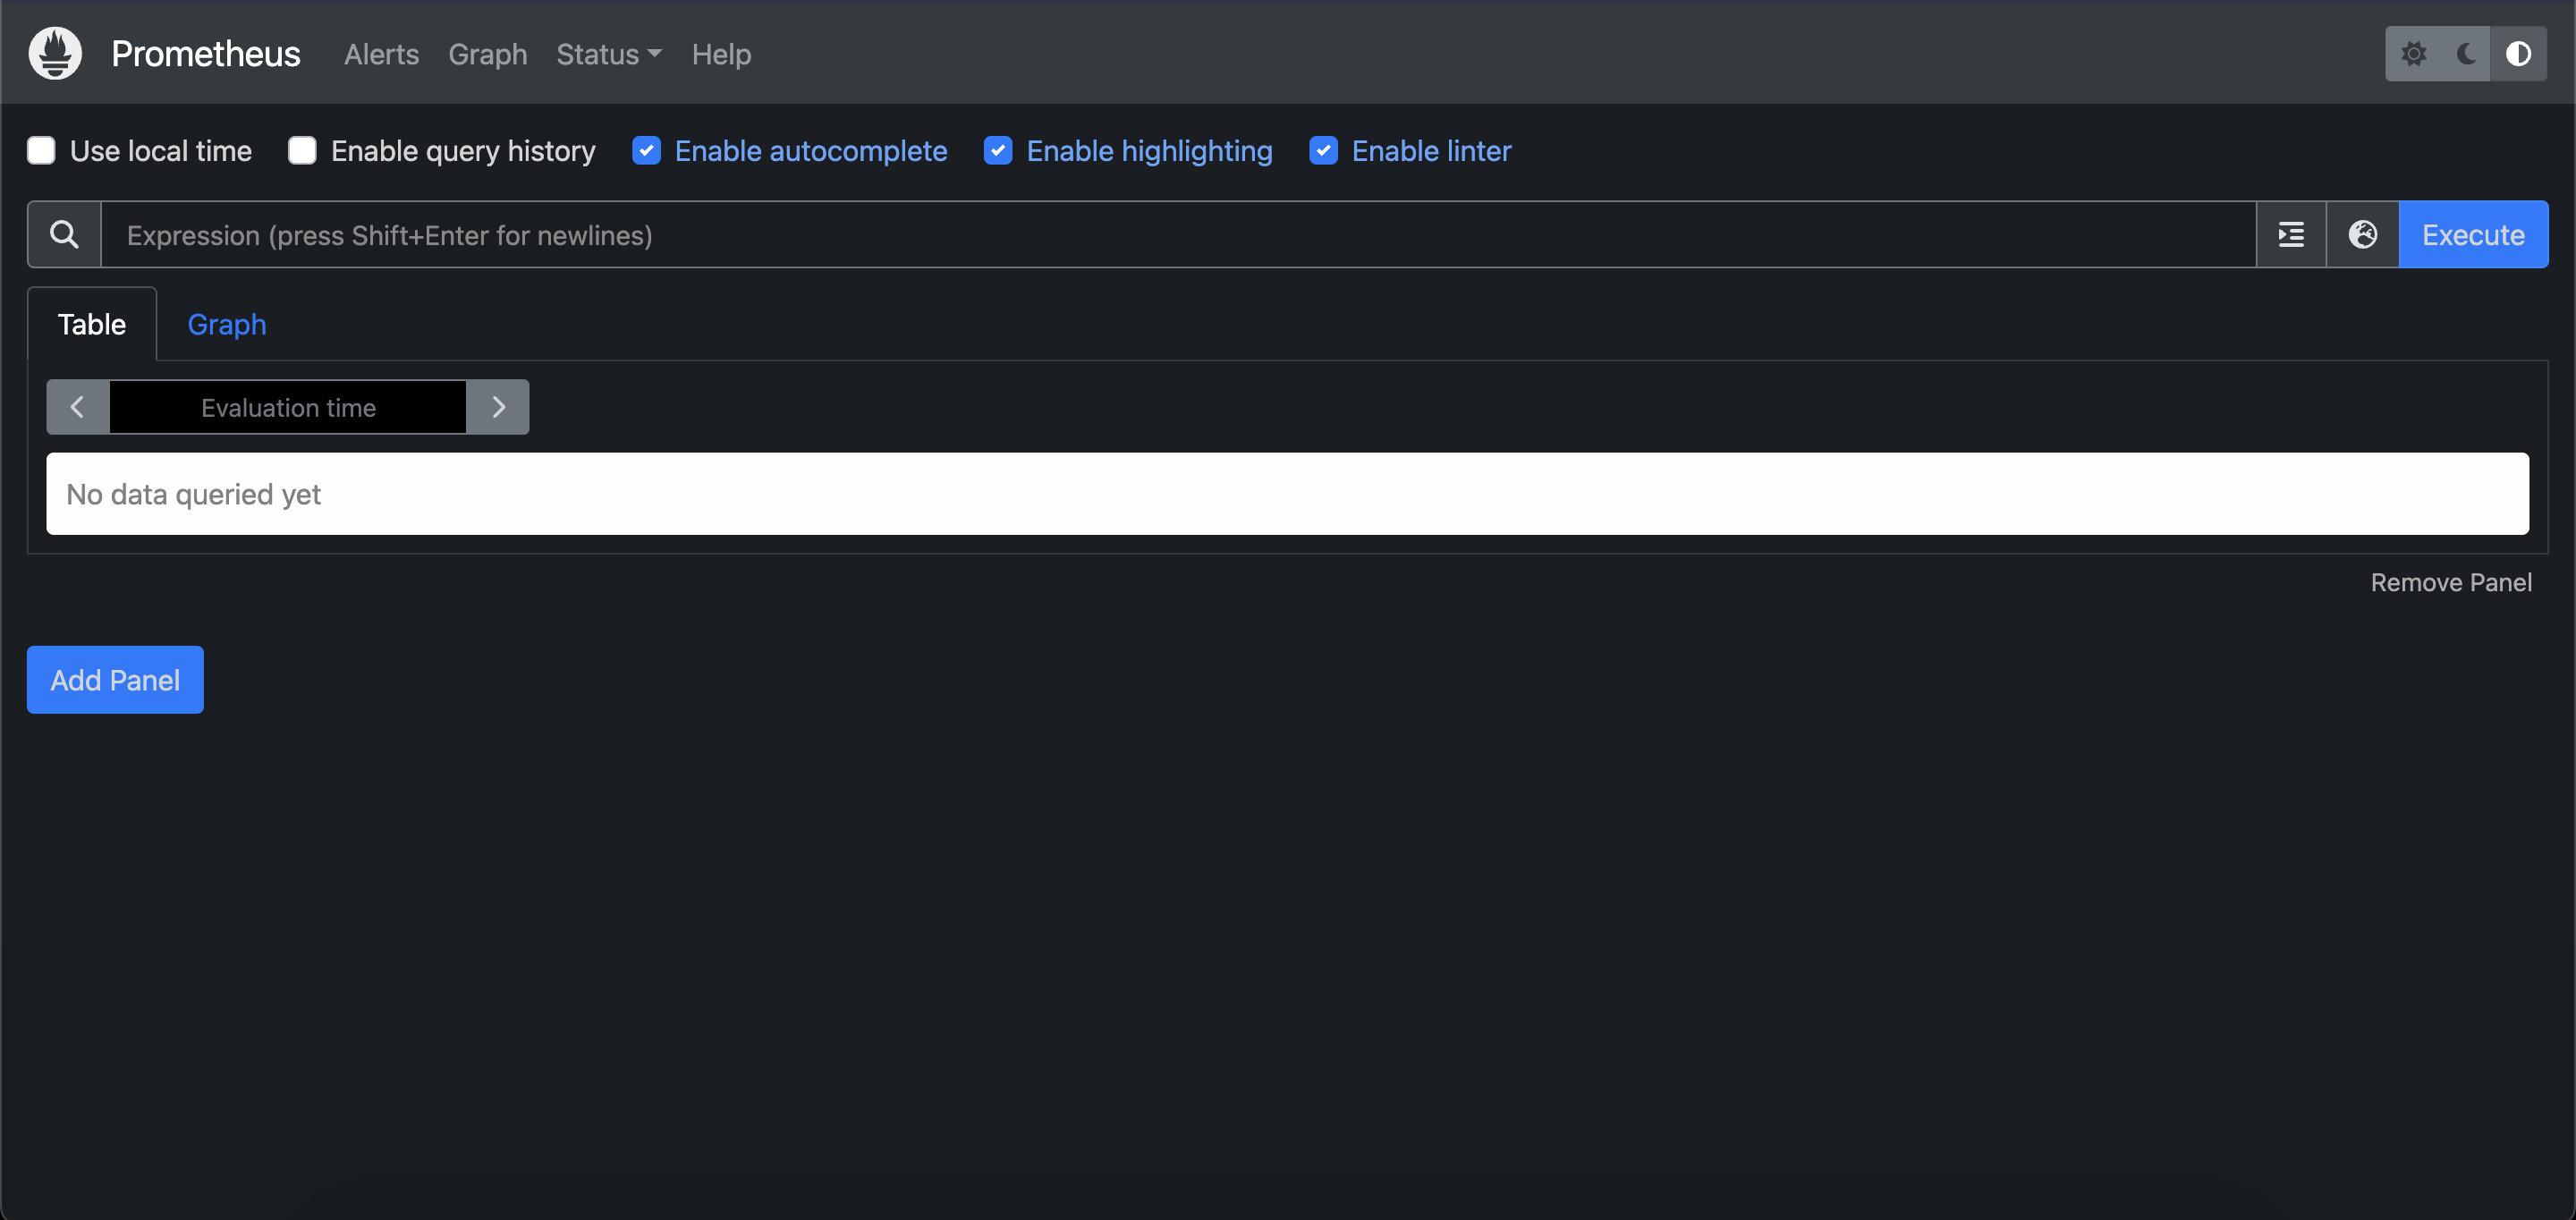
After this, you can visit localhost:9090 to see Prometheus in action:
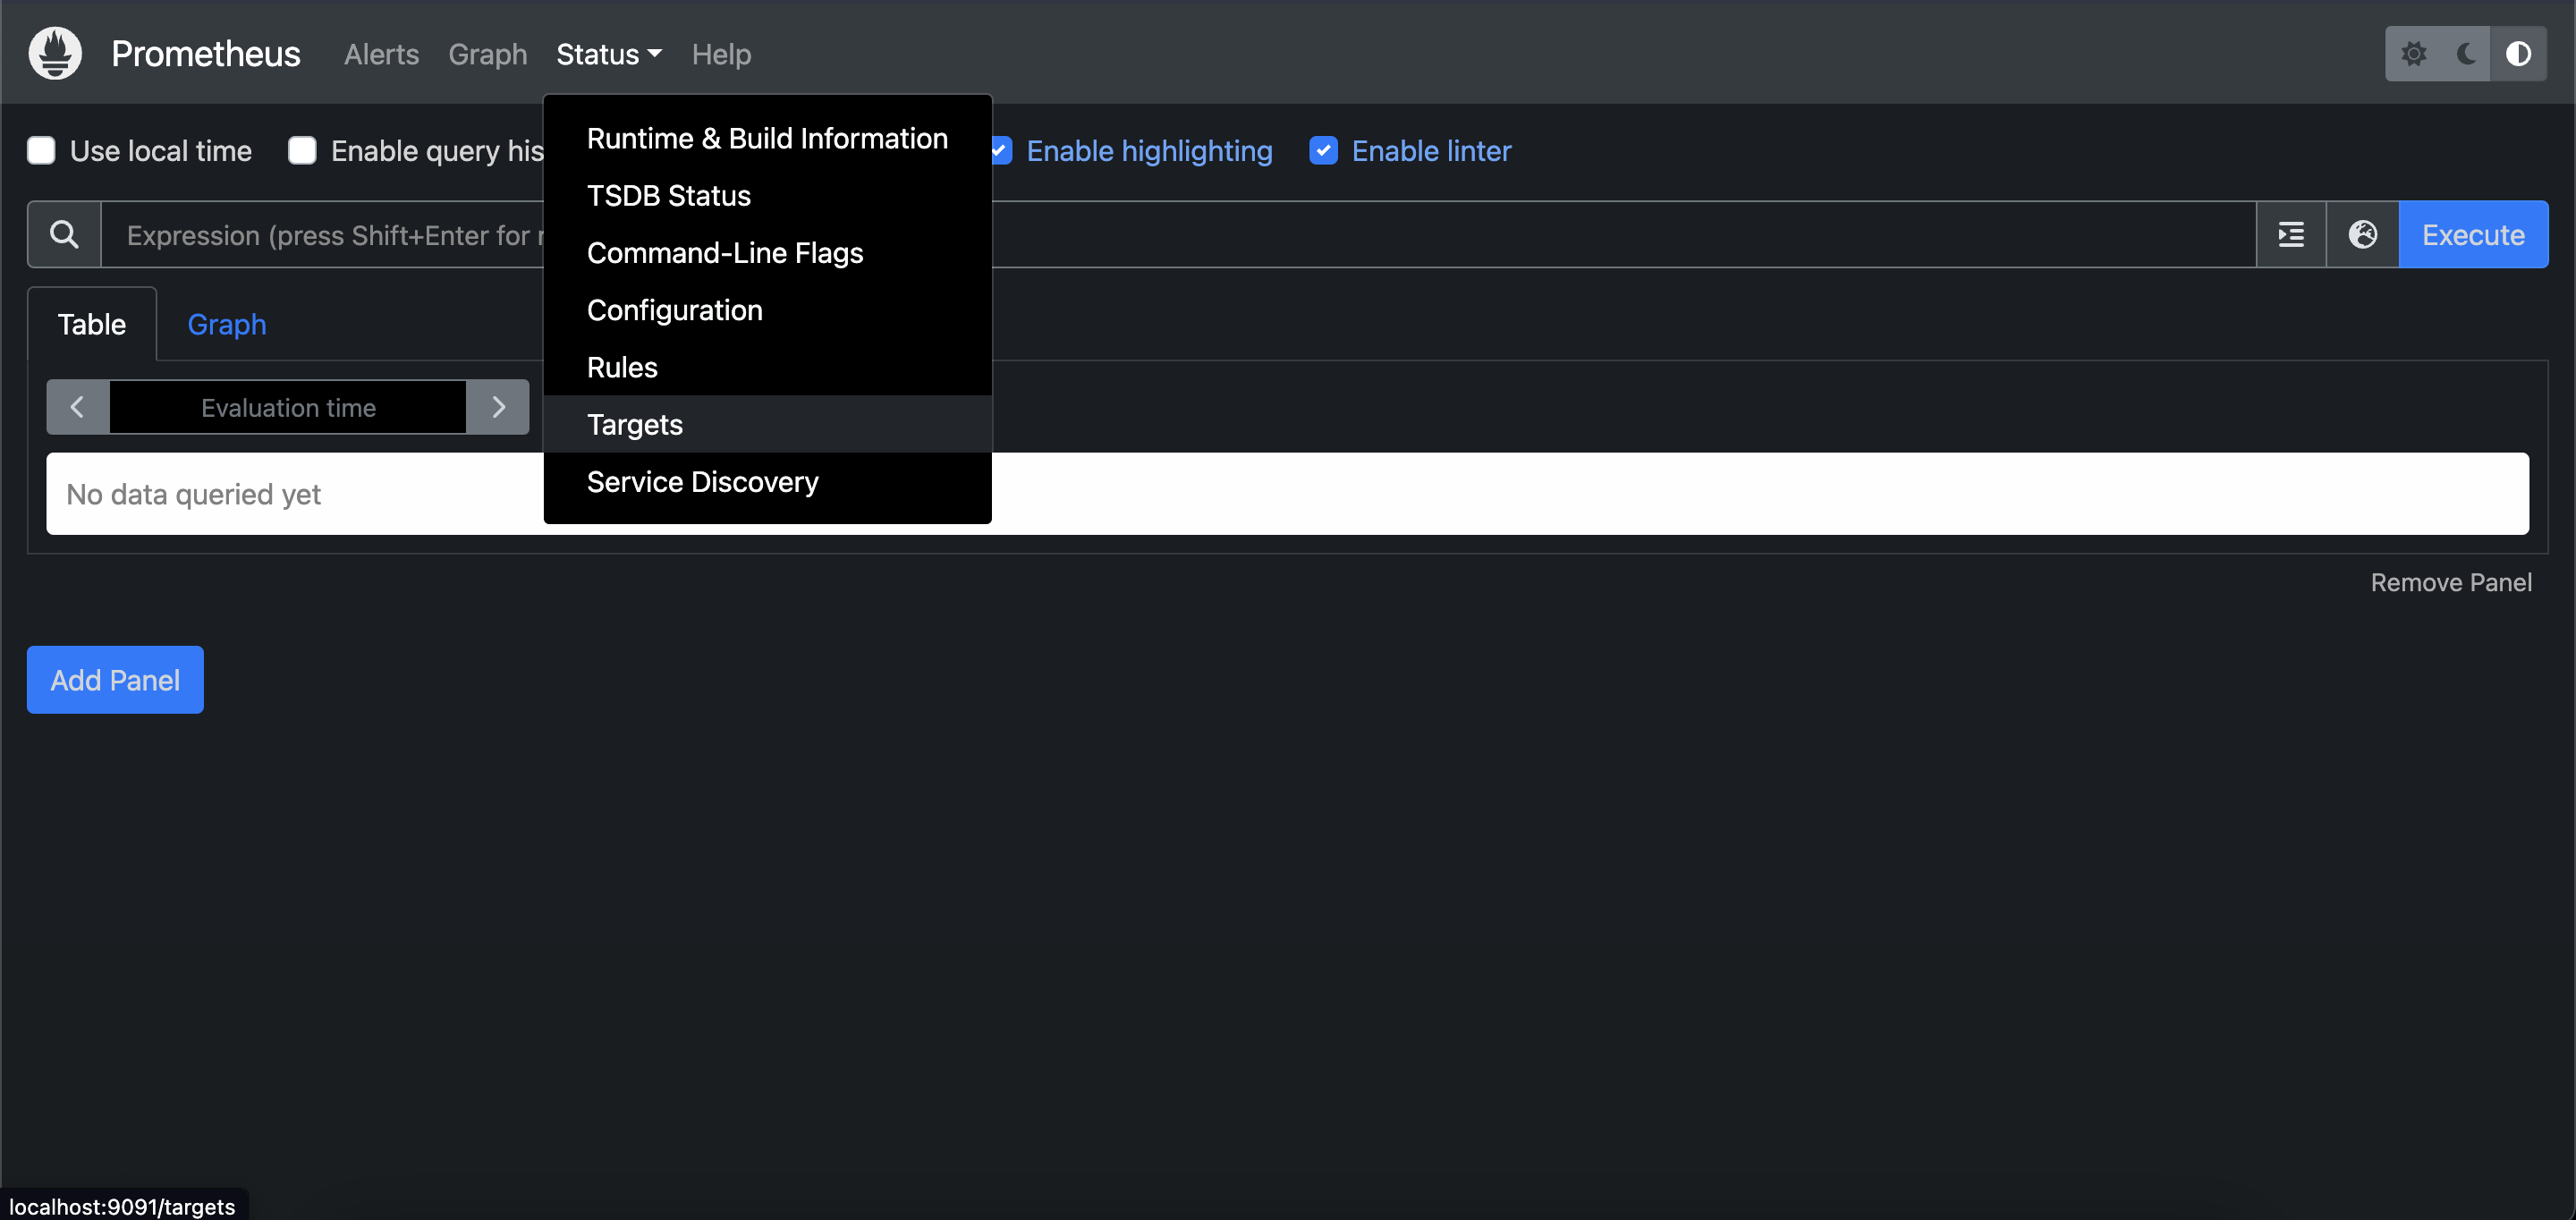
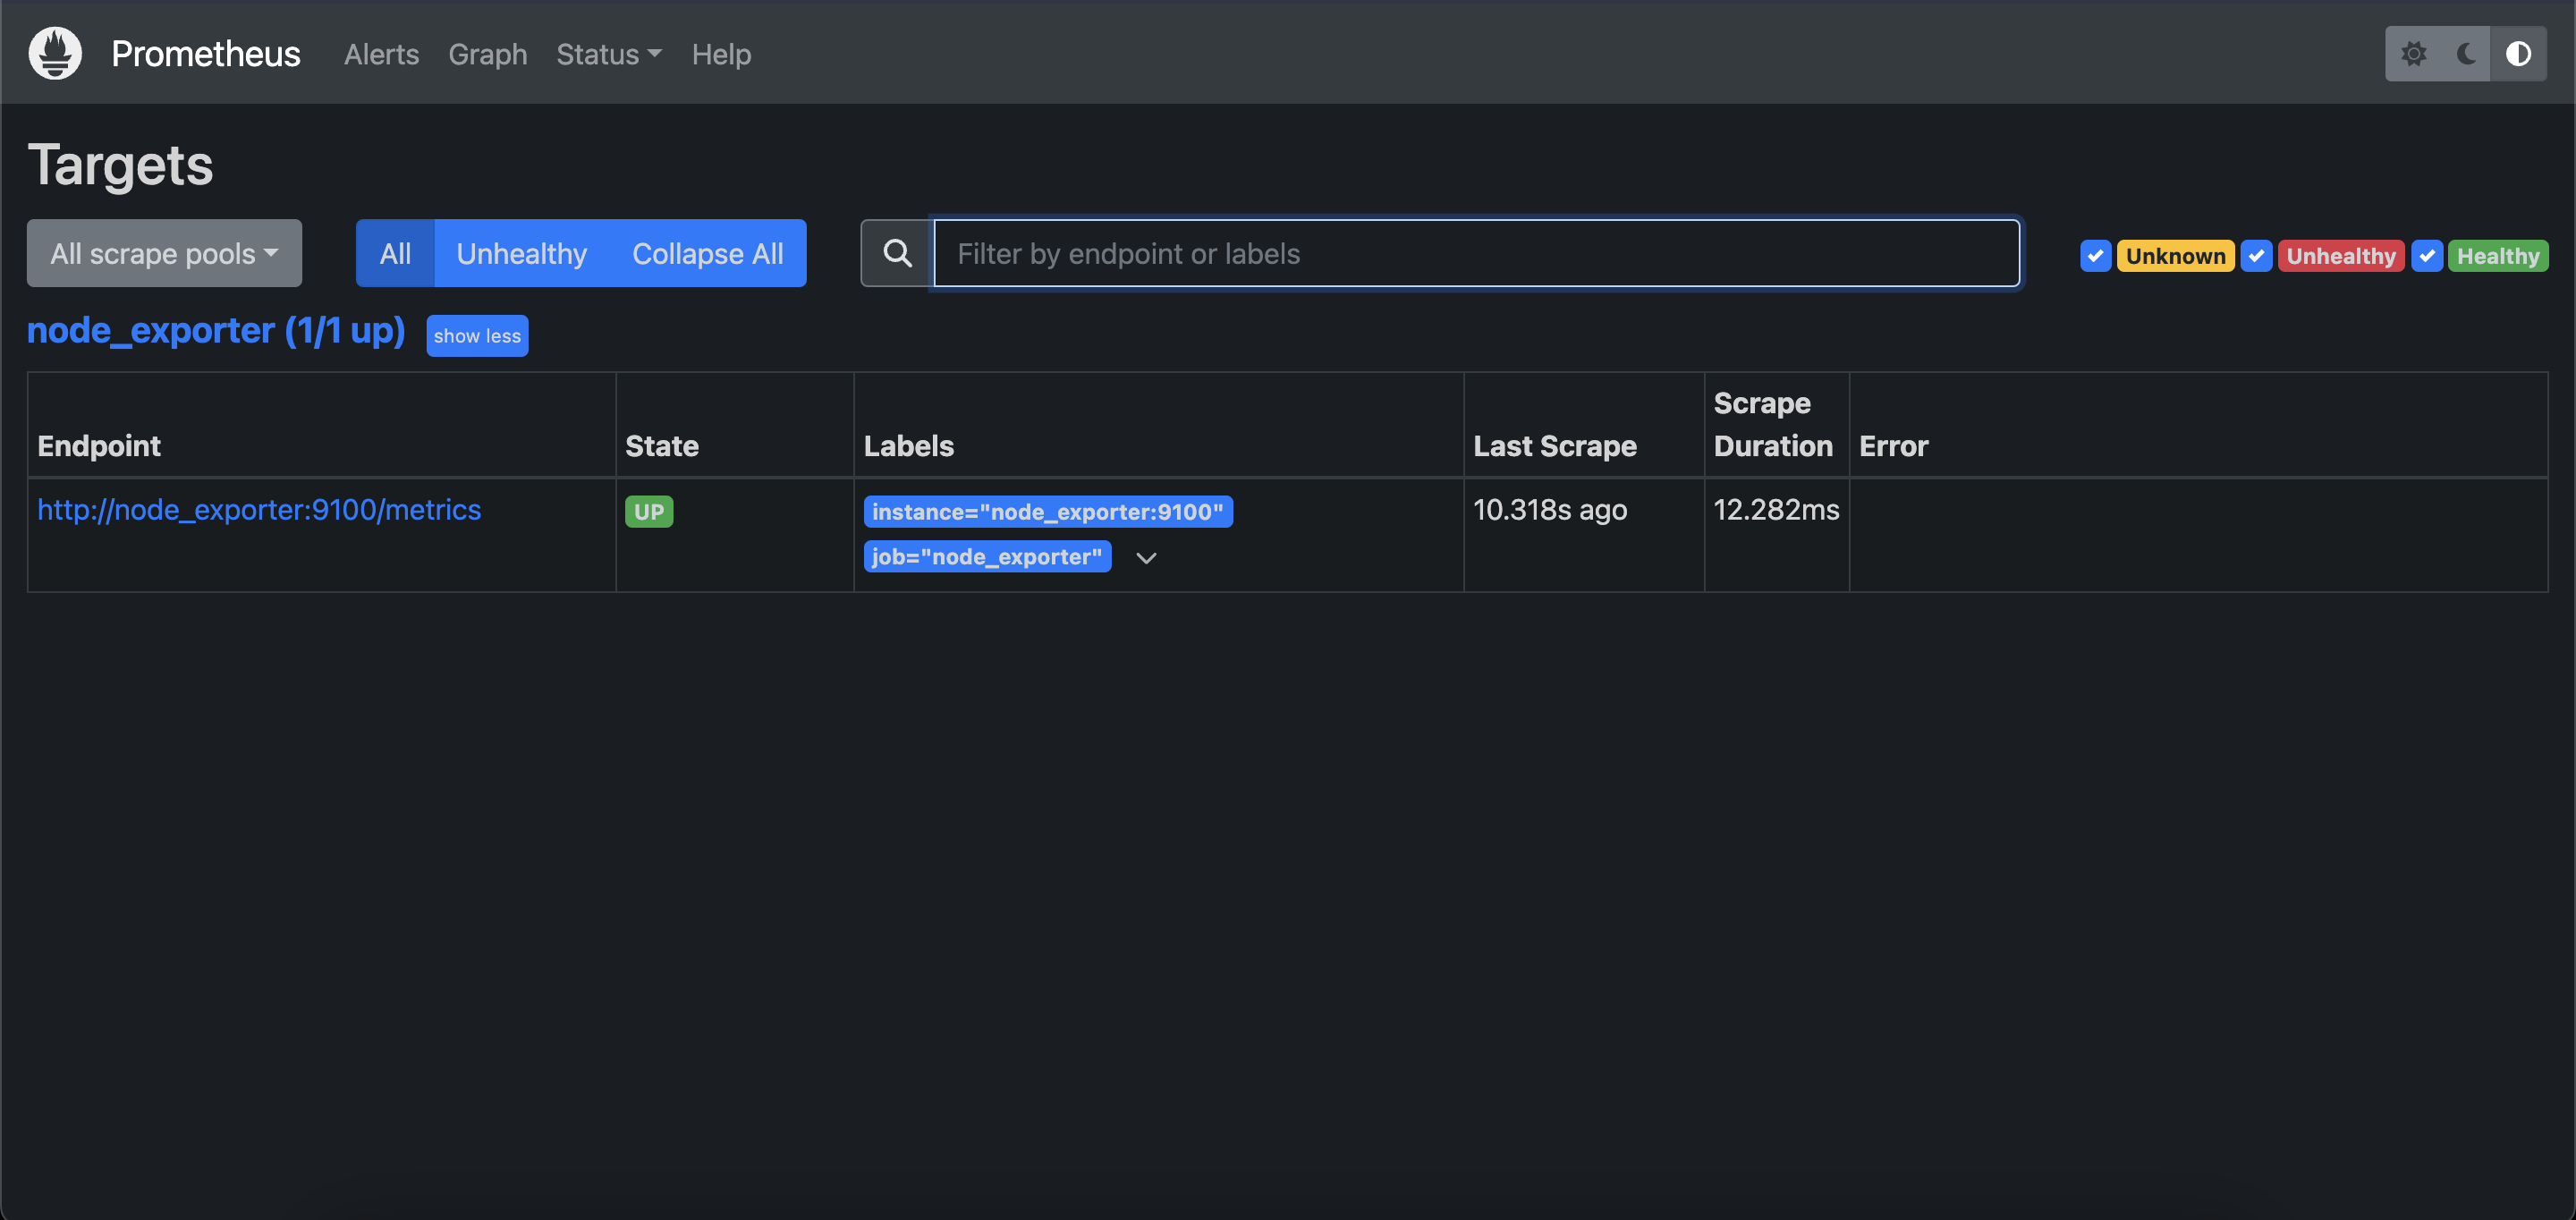
To check if our target is scraped, click on “Status” above, then click on “Targets”.
If you see this, it means that NodeExporter is being scraped successfully.
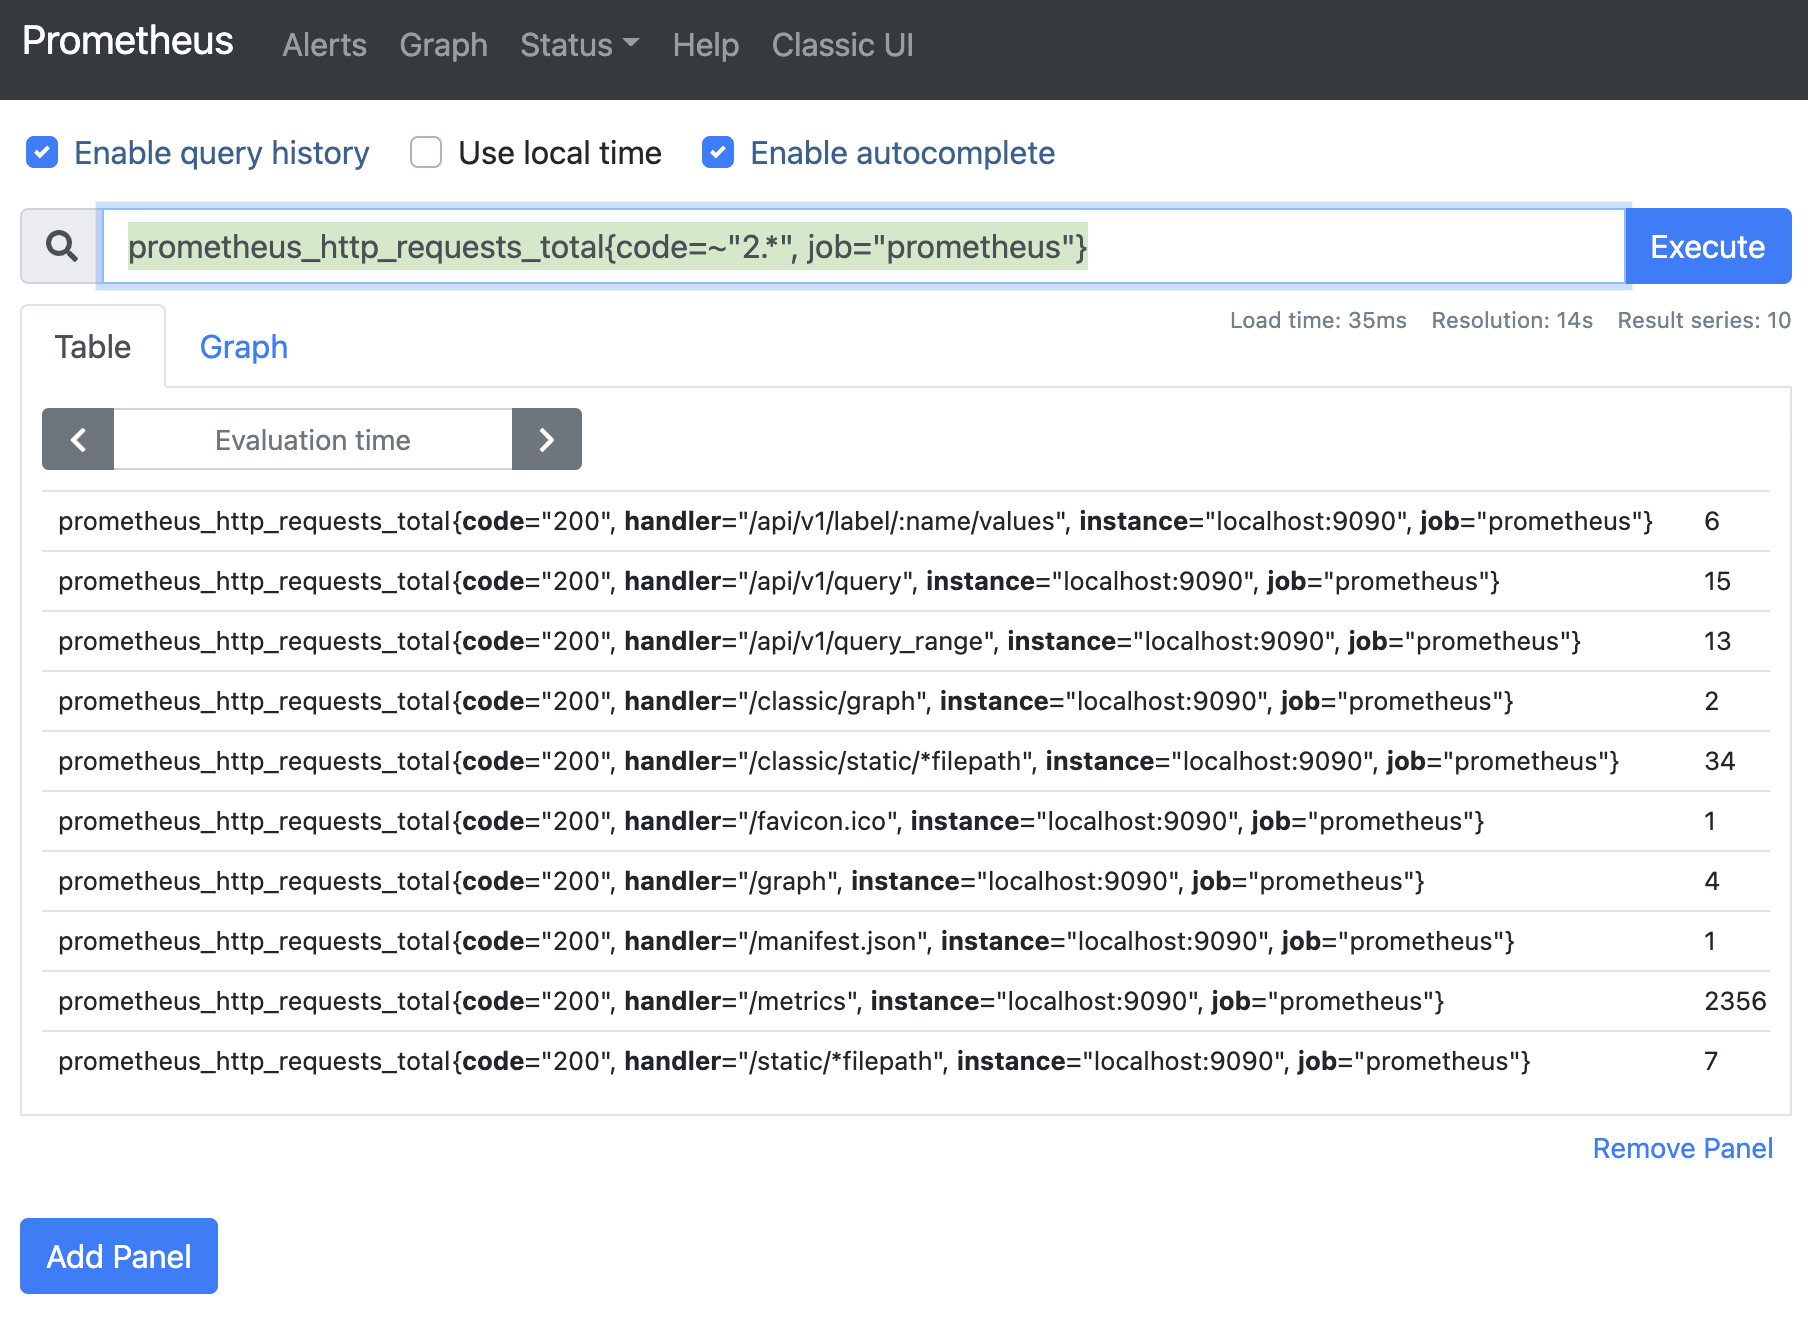
Let’s also see if we get metrics from NodeExporter. For this, click on “Graph” next to “Status”.
Then type node_cpu_seconds_total and press enter. This is a simple query that retrieves the metric node_cpu_seconds_total. If you see the following, it means that Prometheus successfully retrieves metrics from NodeExporter:
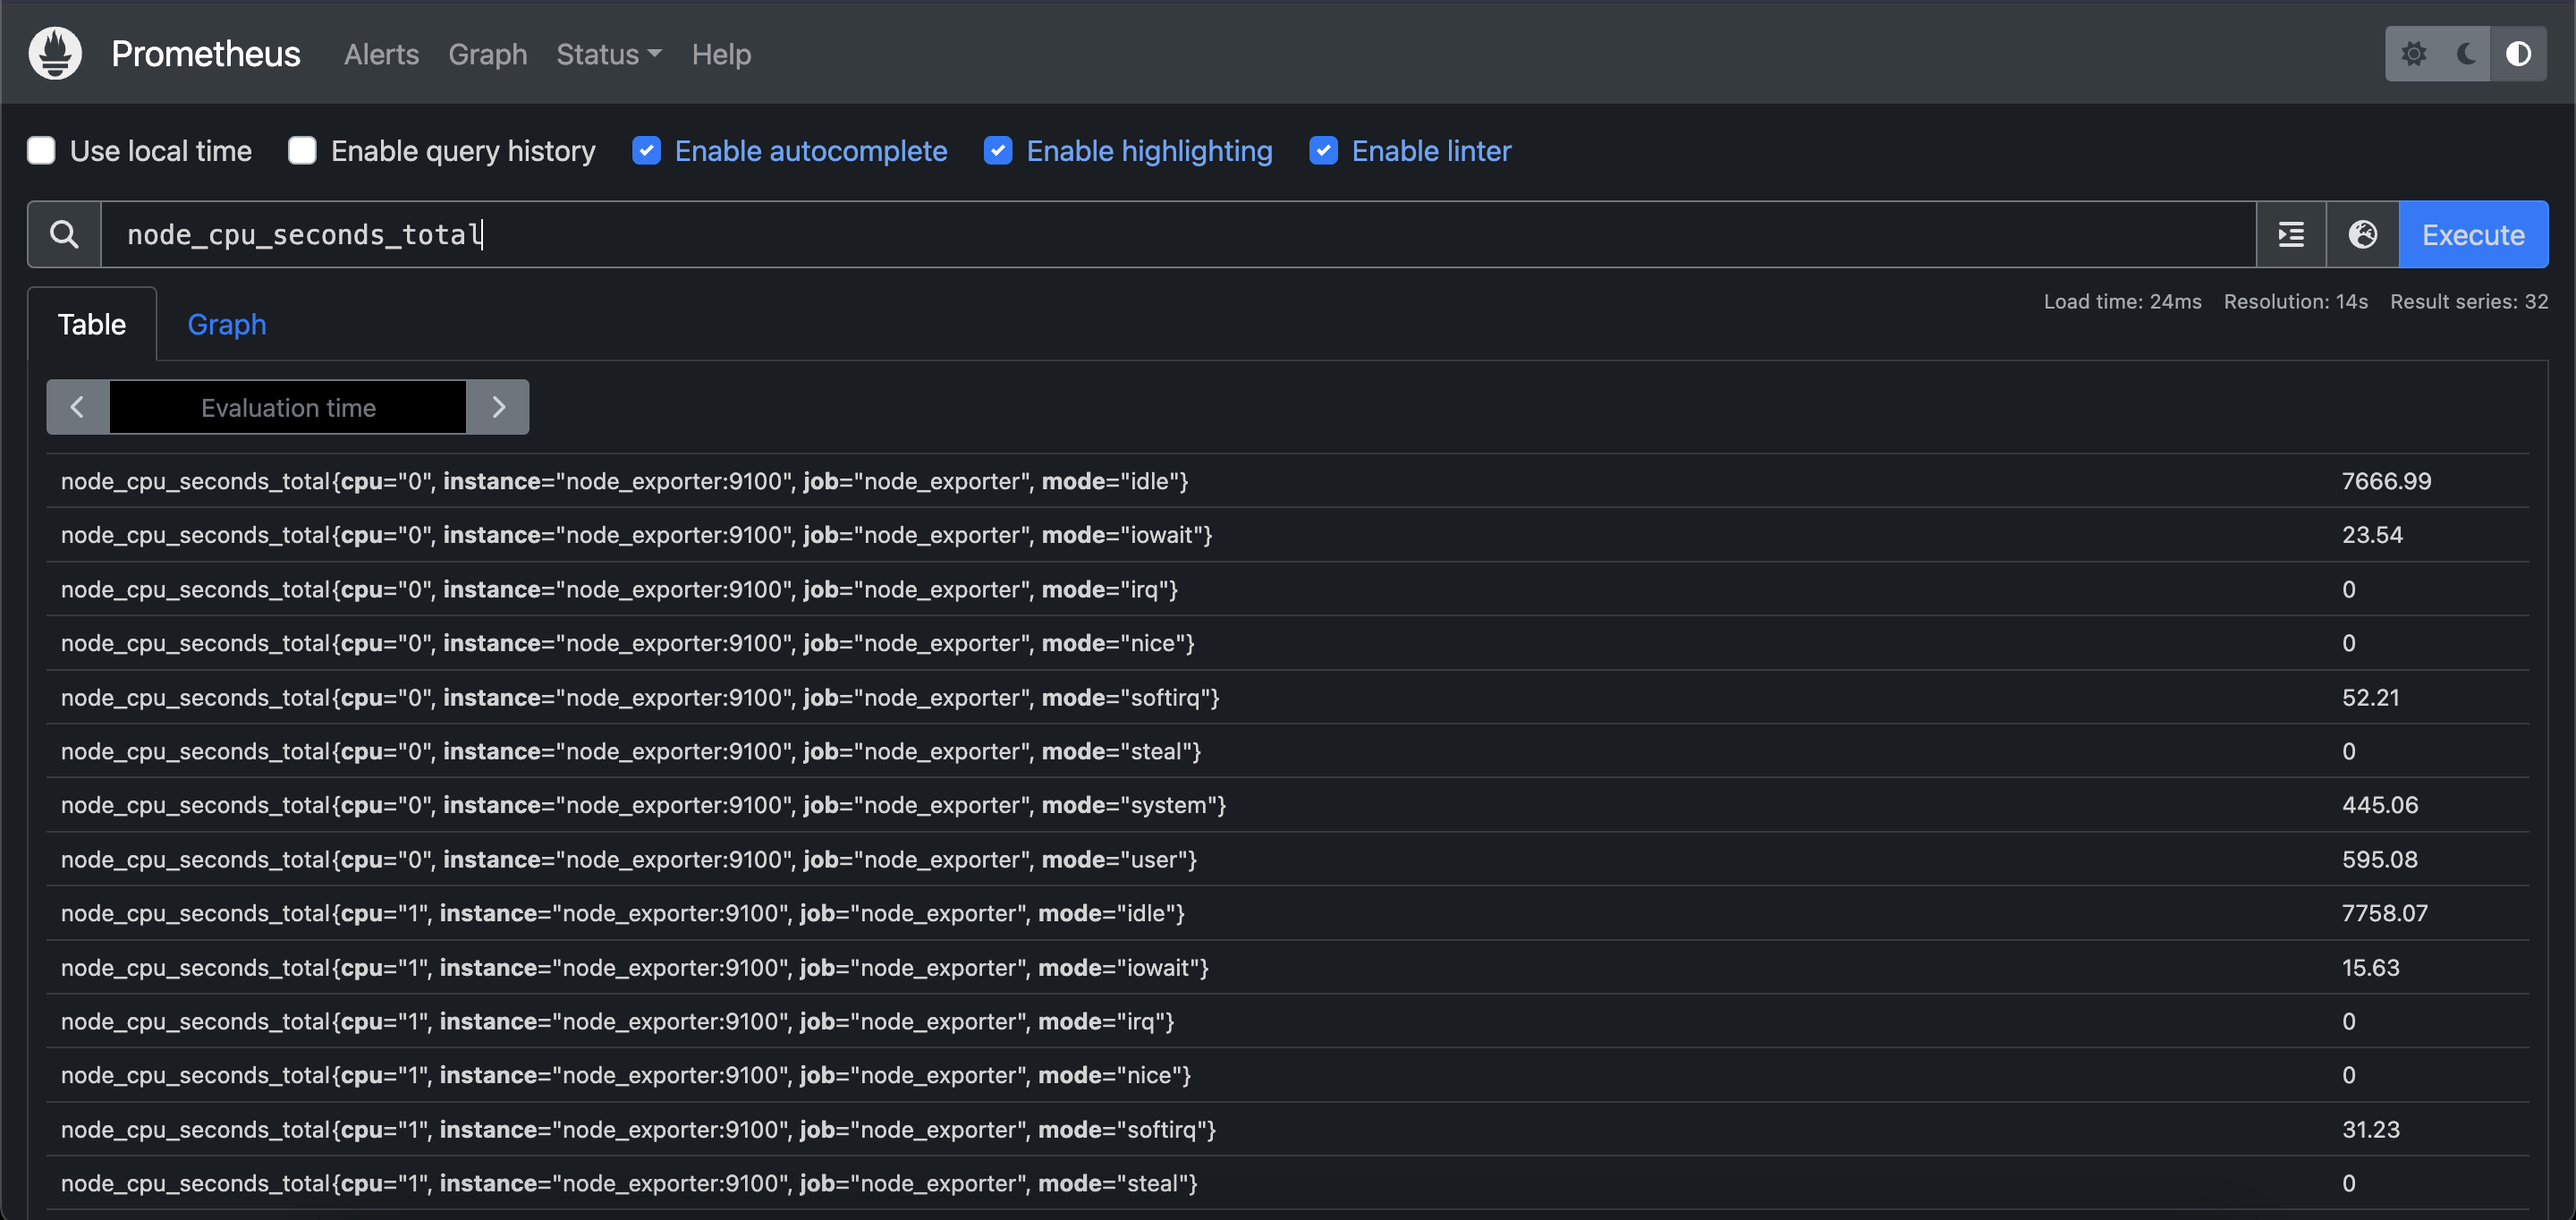
As you can see, we successfully set up a sample application to receive metrics from, and we were able to monitor it using Prometheus. Using this tool, we can learn more about our system such as its bottlenecks, CPU and memory usage, and many more.
Pull vs. Push Based Approach
Prometheus uses a pull based approach, meaning that it scrapes its targets periodically to retrieve the metric data. Even though this approach could pose issues about scaling, it is not a problem in Prometheus as it scrapes aggregated data, not event based data. However, if you require to push data to Prometheus for some reason, you can use workarounds such as Pushgateway explained in the architecture section. For more information about this, you can check here.
Conclusion
As we wrap up the first blog post of our series “Prometheus 101”, we hope that the journey from understanding its core concepts to witnessing a practical demonstration with NodeExporter has been both enlightening and inspiring. Prometheus isn't just another monitoring tool; it's a robust solution designed to meet the complex demands of modern infrastructure and application monitoring.
However, we haven’t talked about the insights we could gain from using Prometheus. We have just started out by setting it up. It is also helpful to learn about:
- Executing PromQL queries
- Alerting
- Service discovery
to use Prometheus to the fullest.
In the next blog post of the “Prometheus 101” series, we will delve deeper into running PromQL queries and what kinds of insights we could gain from using Prometheus. Stay tuned!
If you require any assistance with Prometheus or wish to discuss this topic further, feel free to join our Discord Server.
References
Share on social media: