

Monitoring your Kubernetes cluster is a crucial aspect of managing and ensuring the smooth operation of your system. By monitoring various metrics and logs, you can gain valuable insights into the health and performance of your cluster, identify potential issues or bottlenecks, and take proactive measures to optimize its stability.
In this guide, we will explore key steps and considerations for effective Kubernetes cluster monitoring. Here are 5 tips to help you monitor your Kubernetes cluster:
- Define relevant metrics and alerts
- Choose the right monitoring tools
- Check your logs regularly
- Look out for patterns
- Focus on the cluster as a whole
1. Define Relevant Metrics and Alerts
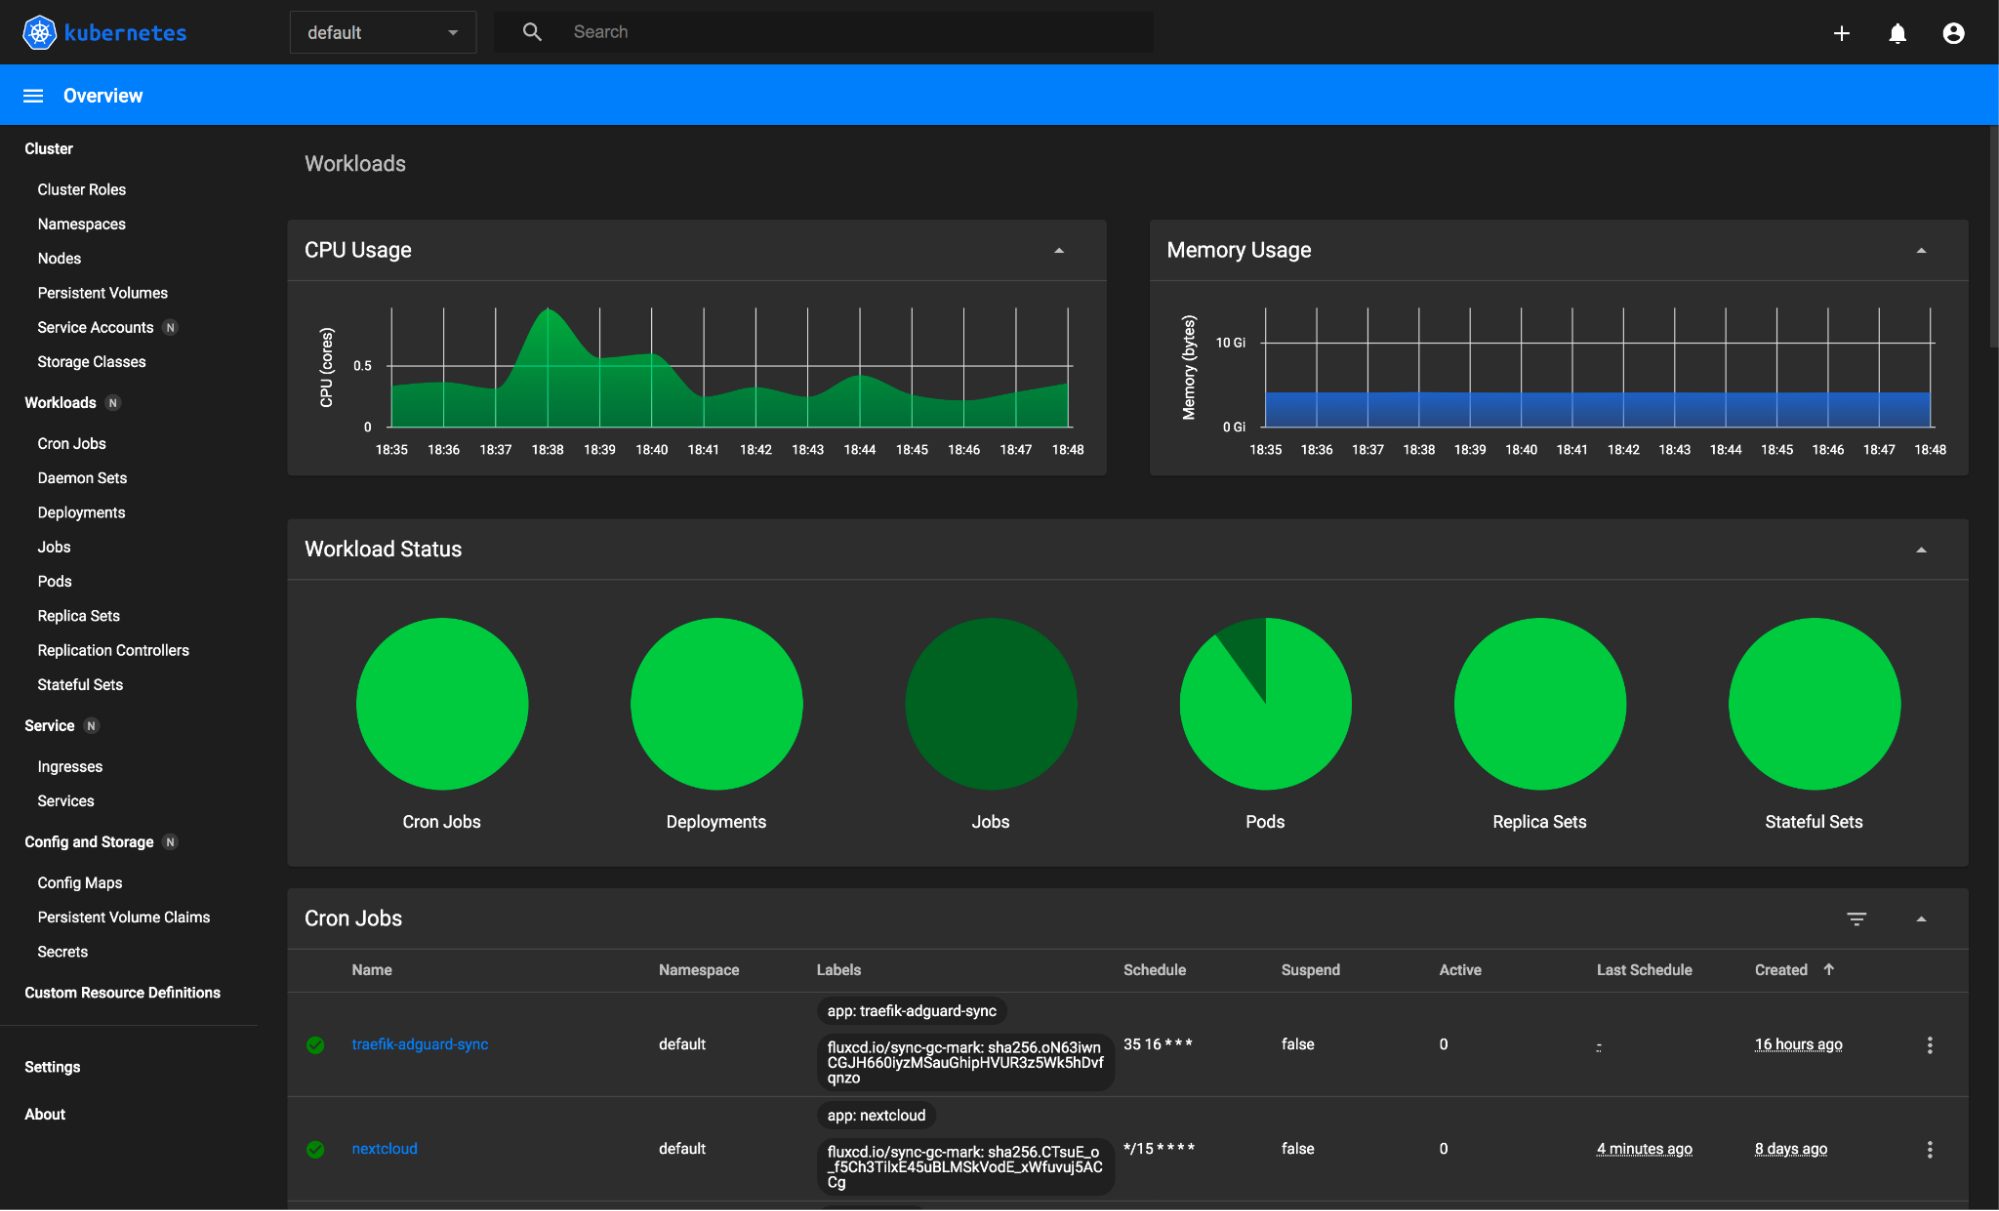
Managing a cluster's health involves monitoring various key performance indicators (KPIs) and metrics critical to maintaining optimal performance. Establishing thresholds for these allows for proactive identification of anomalies or resource constraints within the cluster. These metrics might include:
- CPU and memory utilization
- Pod and node status
- Network metrics
- Application-specific metrics
Establish thresholds for these metrics to trigger alerts effectively. Set up alerts and notifications for anomalies, potential failures, resource bottlenecks, or any unusual behavior within the cluster.
You can also establish escalation procedures so that the right team members are notified at the appropriate severity levels, allowing for effective troubleshooting and resolution within the cluster.
Here are some resources to start with:
2. Choose the Right Monitoring Tools
In order to effectively monitor and manage your systems, it is important to carefully select the right tools that align with your specific needs. This can help you detect and troubleshoot any issues or anomalies in real-time, minimizing downtime and potential disruptions to your operations. Therefore, take the time to evaluate and choose the monitoring tools that best suit your requirements and objectives. You can choose from a wide range of open-source and commercial tools, including:
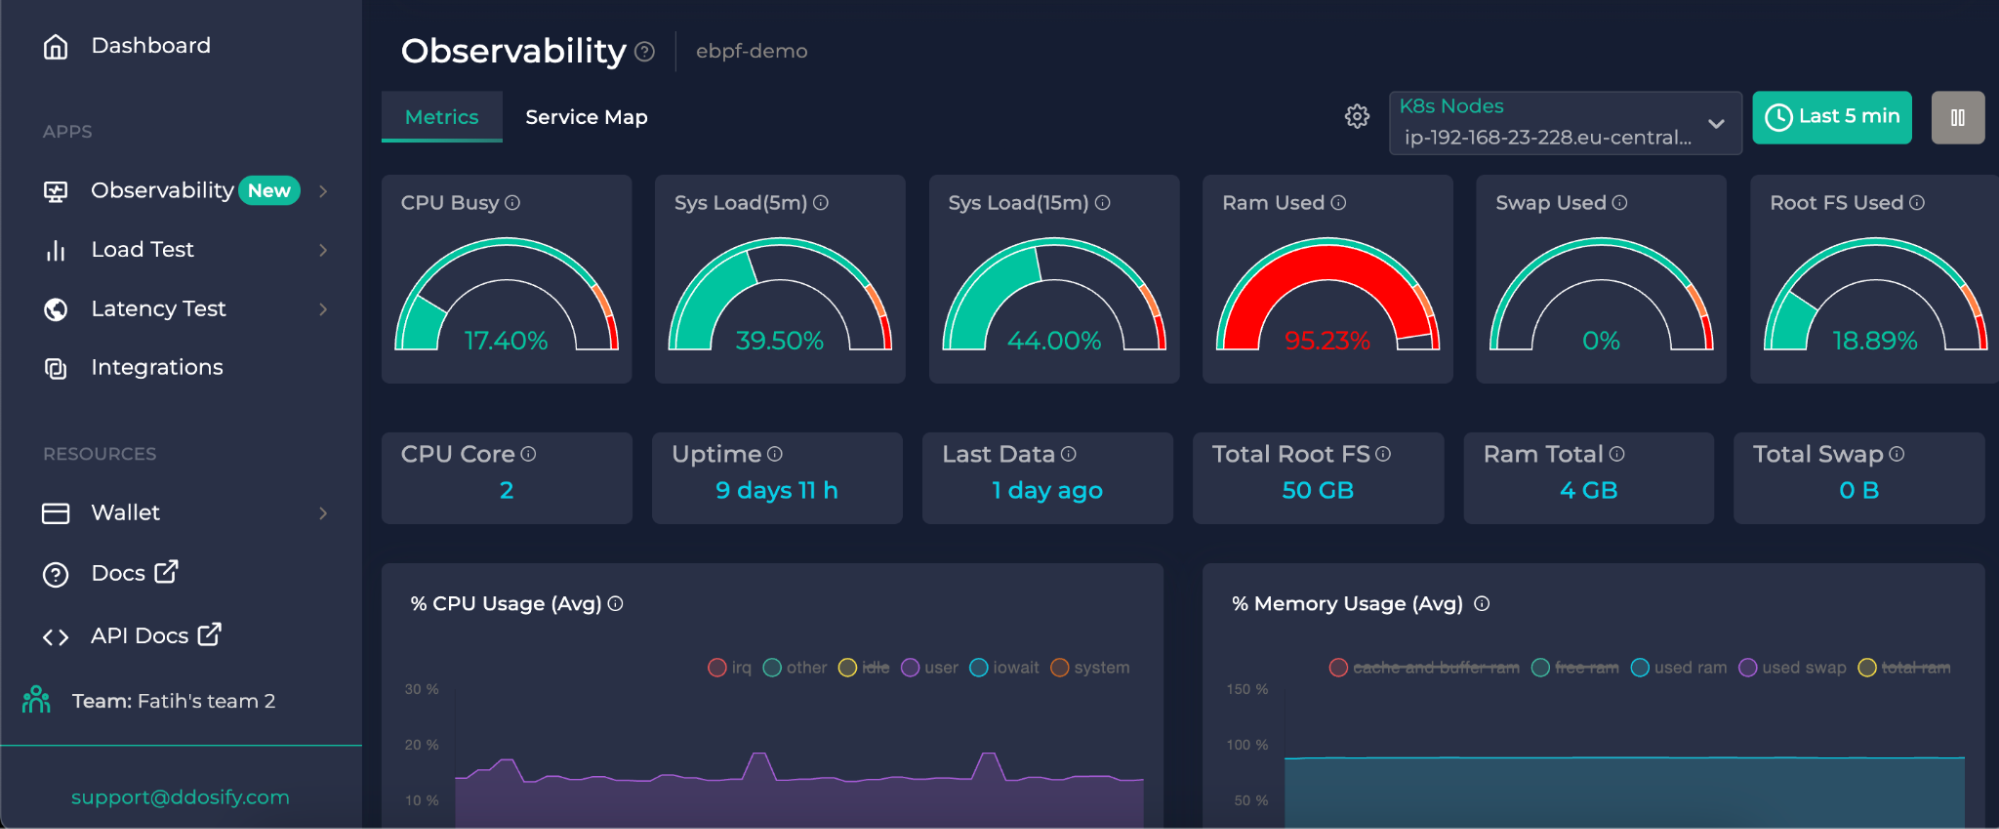
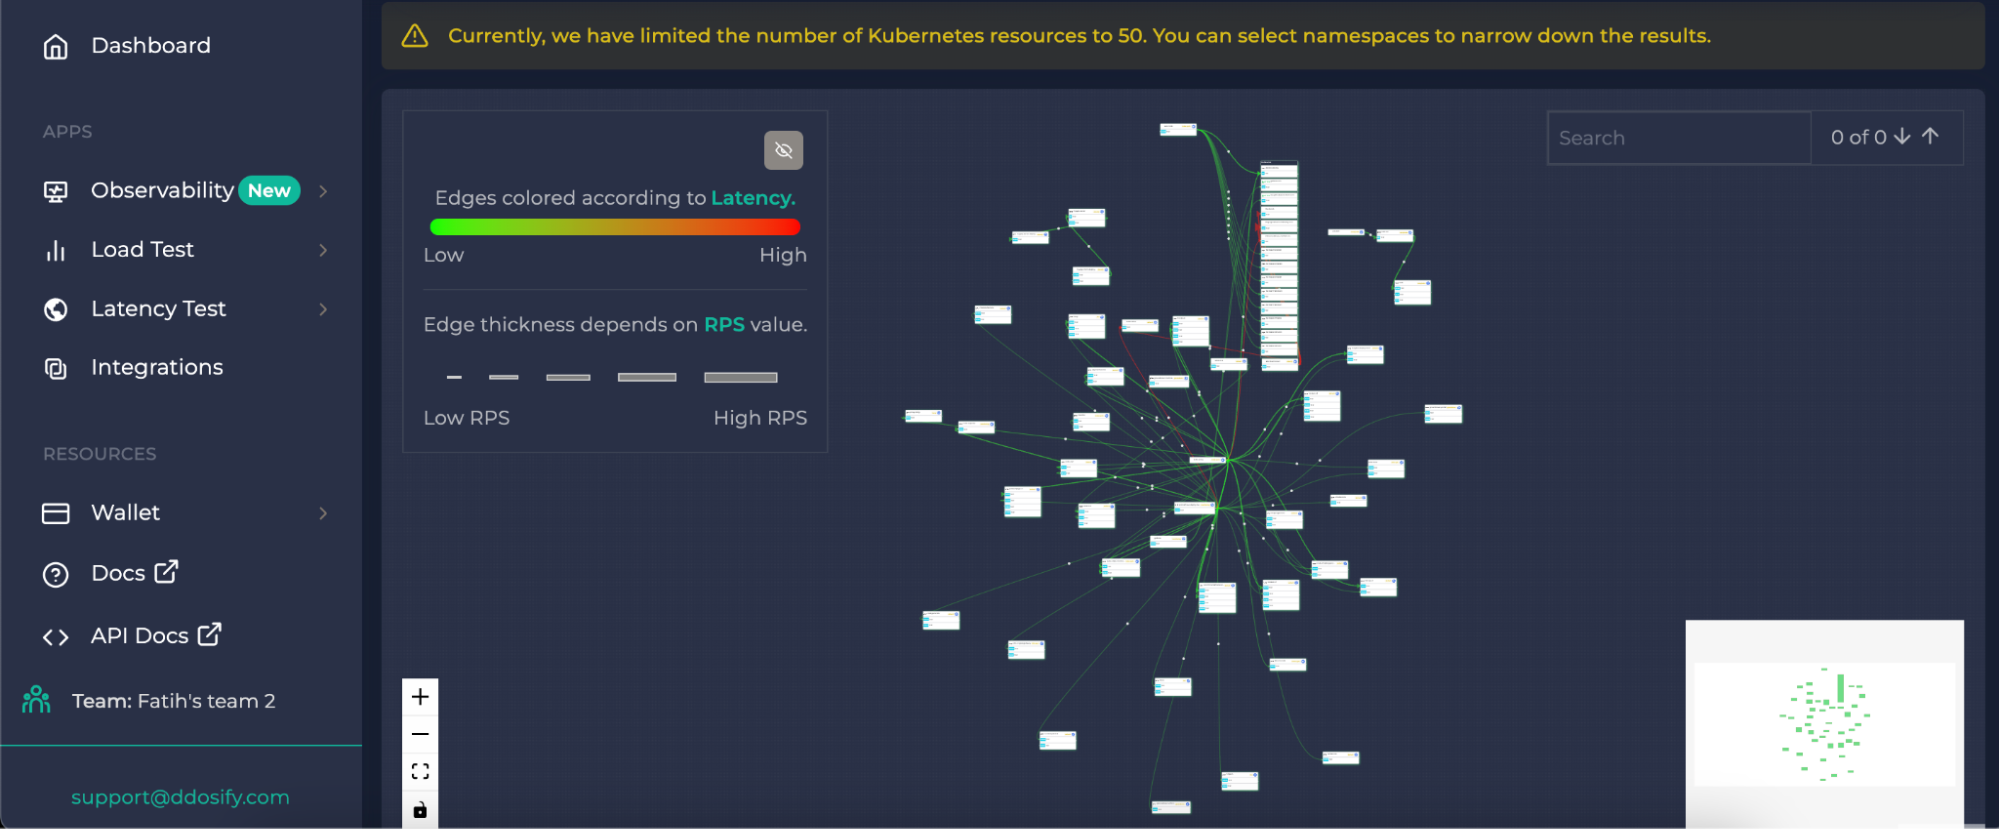
- Ddosify is an easy-to-use tool that allows you to monitor your cluster without much configuration. It provides cluster metrics and the service map data alongside the support for alerts and built-in notifications.
Ddosify Metrics
Ddosify Service Map
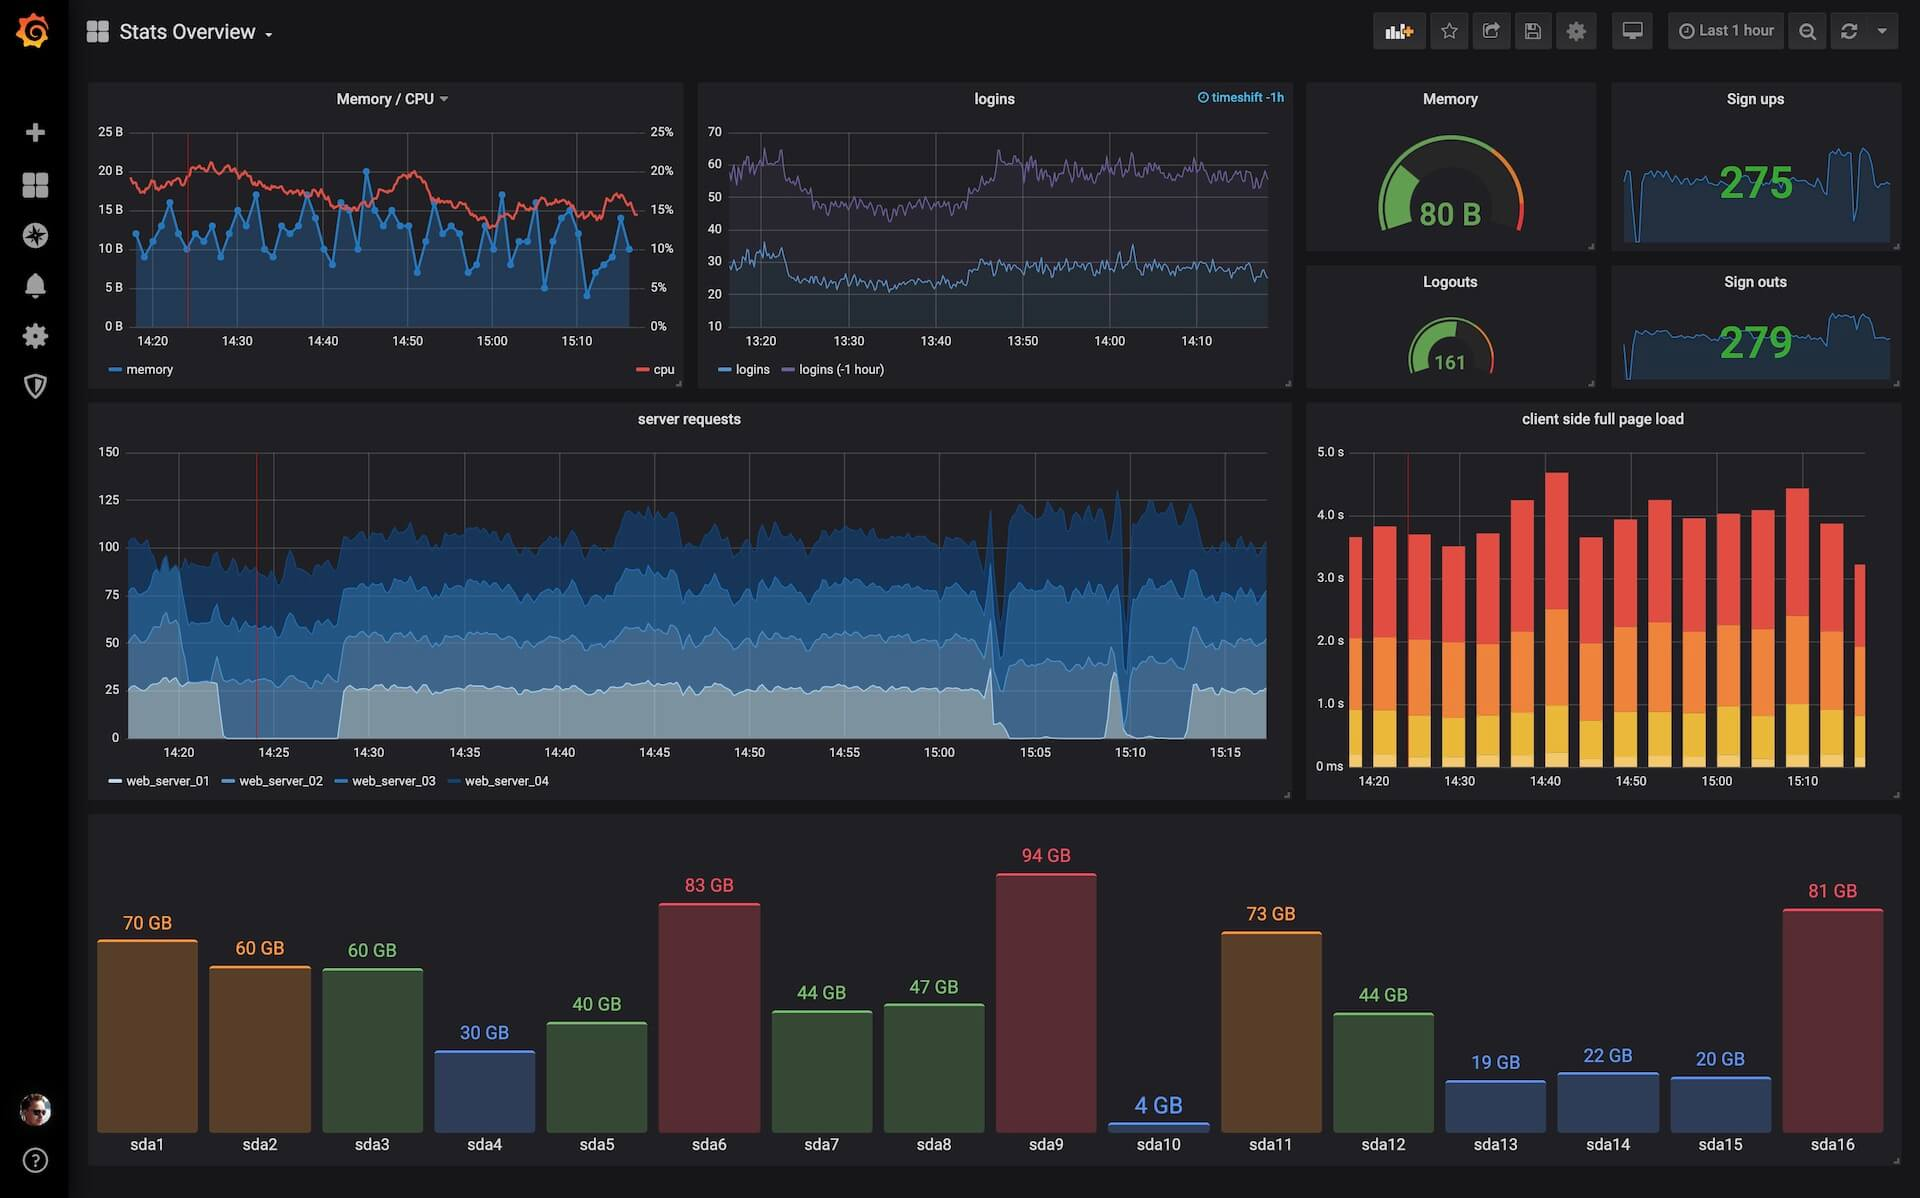
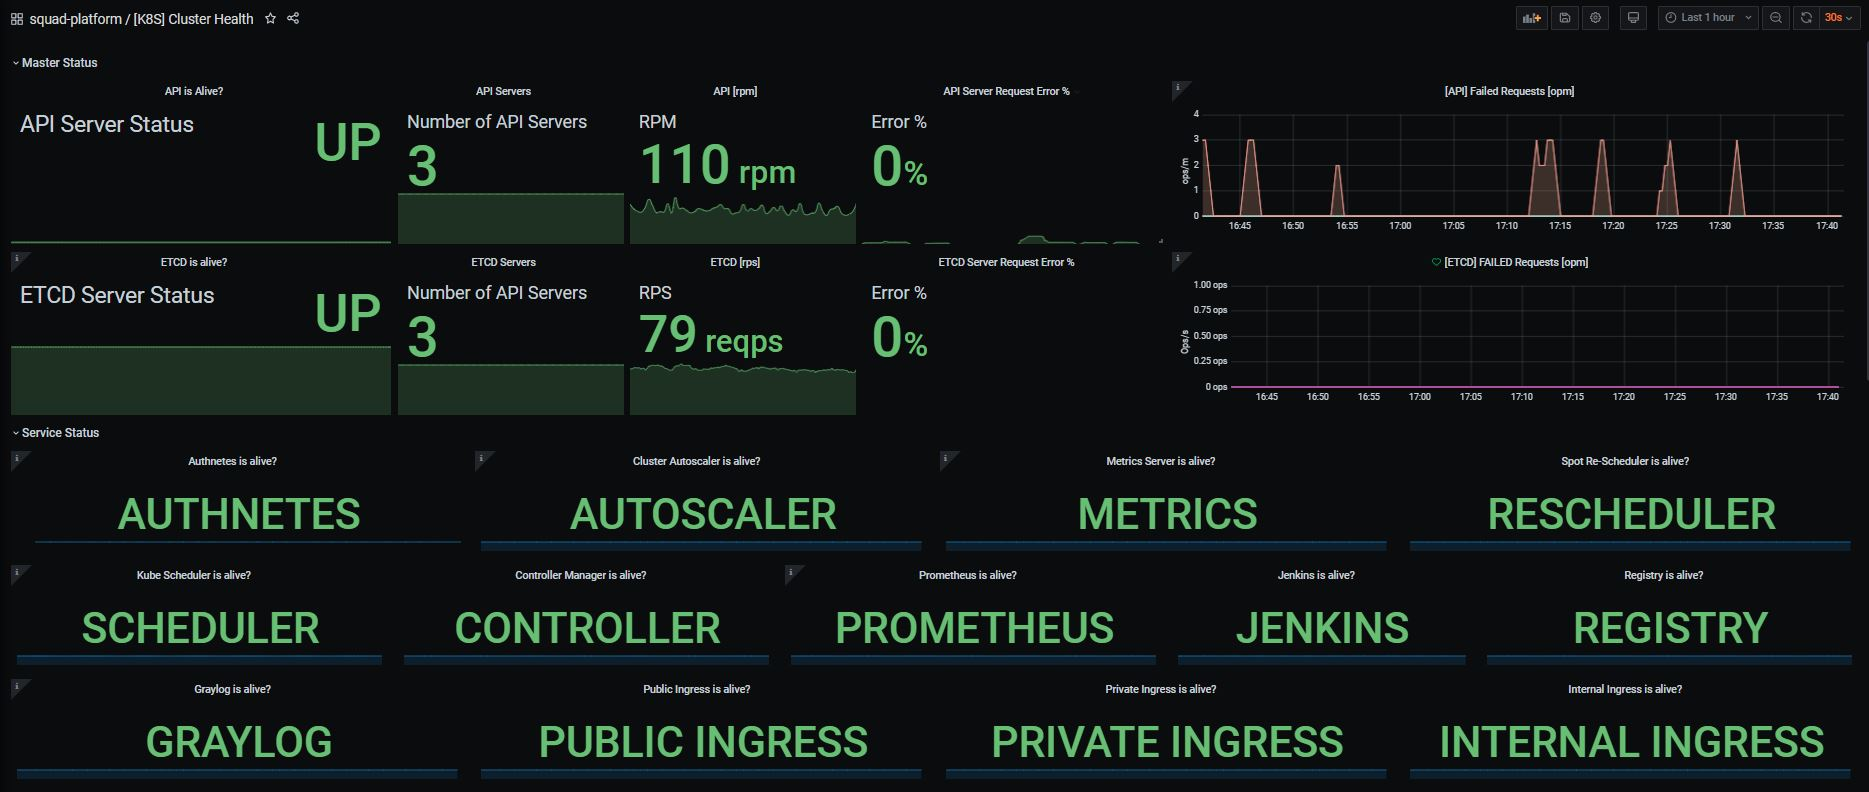
- Prometheus is a popular choice for Kubernetes monitoring, offering extensive metric collection capabilities. Coupled with Grafana for visualization, it provides a powerful monitoring stack.
Grafana
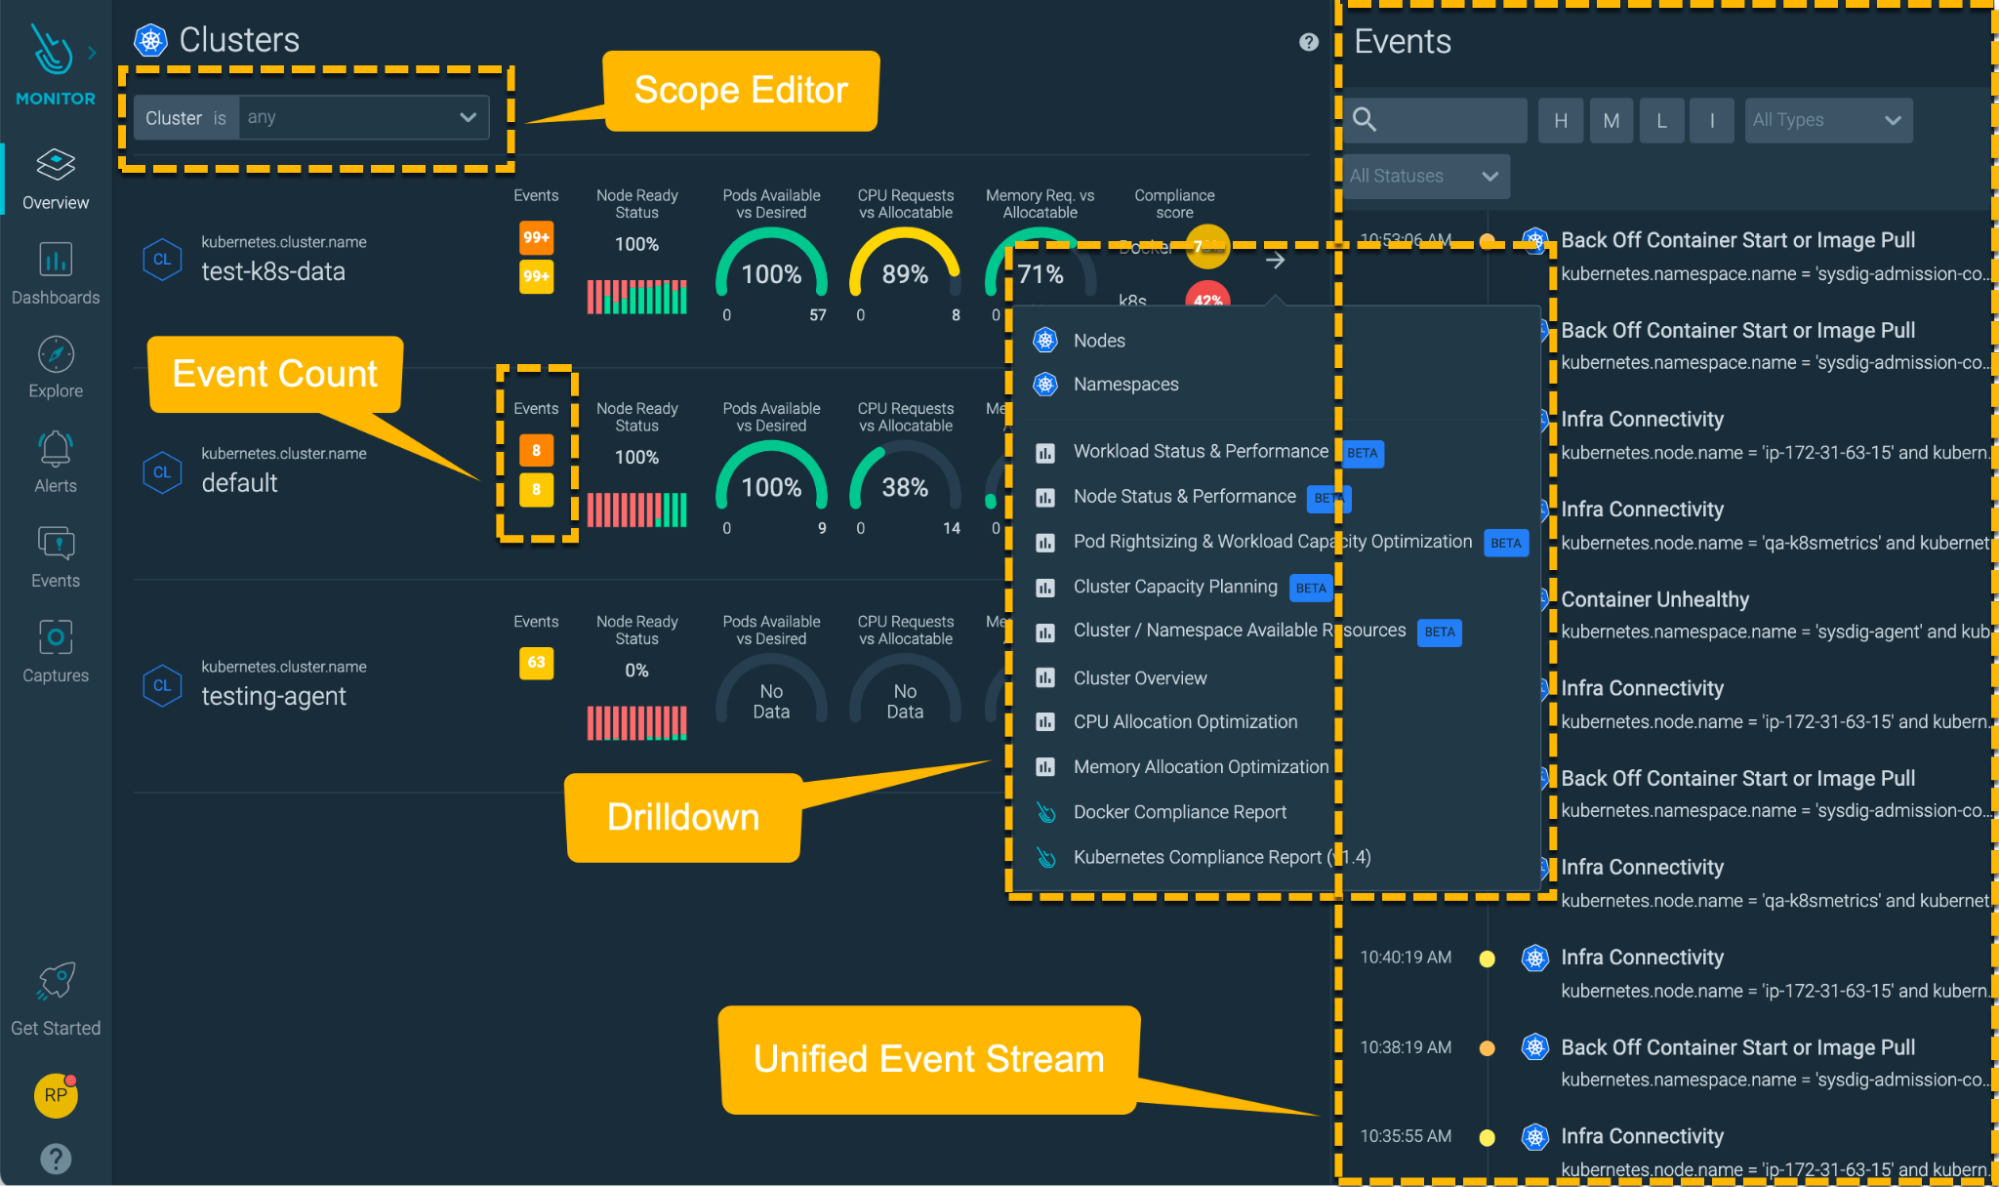
- Other options like Datadog, Sysdig, or the Kubernetes-native monitoring solution, kube-state-metrics, can also be beneficial.
Sysdig
Kube State Metrics
Assess each tool's features, scalability, ease of integration, and compatibility with your infrastructure. If you have questions on how to do that, you might want to check this:
Unpacking Observability: How to Choose an Observability Vendor
3. Check Your Logs Regularly
Kubernetes logs are a fundamental aspect of cluster management, offering crucial visibility into the intricate workings of its components. Regularly reviewing and analyzing the logs generated by your cluster's components is another important step in monitoring your Kubernetes cluster.
Logs provide valuable insights into the behavior and status of your cluster, helping you identify any errors or issues that may be impacting its stability. By closely monitoring them, you can proactively address any problems and ensure the seamless functioning of your cluster.
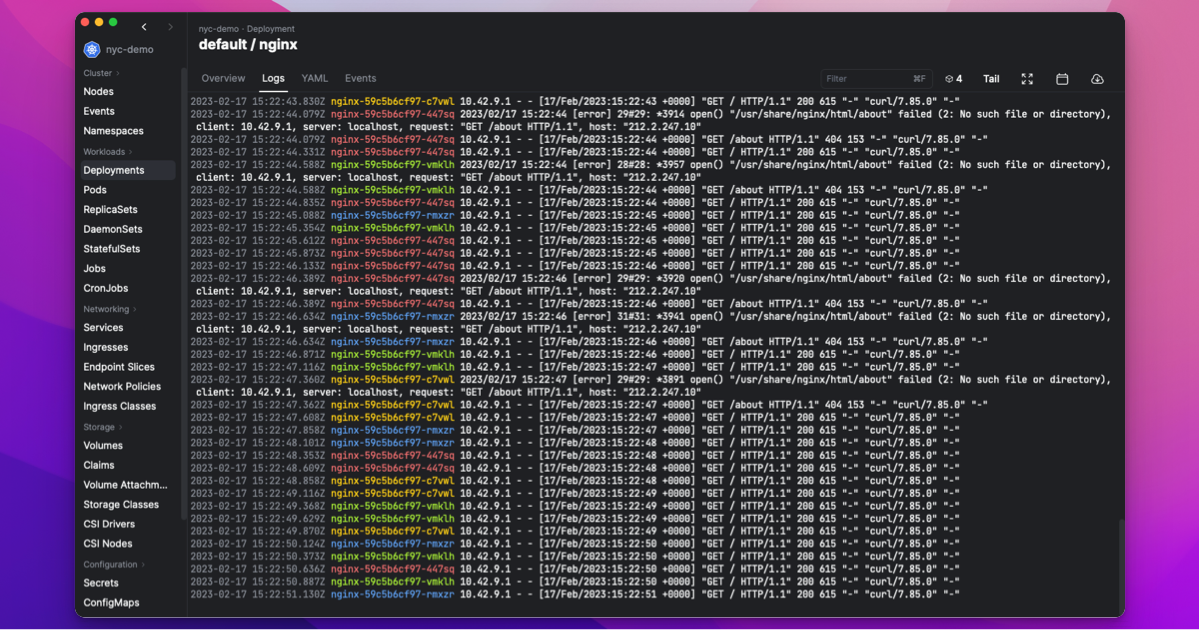
To do so, you can either make use of the monitoring tools or you can simply execute Kubernetes commands. Here are some tips on the latter:
Troubleshooting Kubernetes: Cluster and Node Logging
Logs
4. Look Out for Patterns
Identify patterns in the metrics and logs of your Kubernetes cluster. Look for recurring issues, trends, or anomalies that may indicate underlying problems or areas for improvement. By recognizing these patterns, you can take proactive measures to optimize your cluster's performance and stability. Here are some examples:
- Recurring issues might manifest as frequent error codes, performance bottlenecks, or specific component failures within the cluster.
- Trends might emerge in resource utilization patterns, such as spikes in CPU or memory usage during certain times of the day or in response to specific events or workloads.
- Anomalies could be deviations from expected behavior, sudden fluctuations in network traffic, or unexpected variations in response times across services.
5. Focus on the Cluster as a Whole
When monitoring your Kubernetes cluster, it's easy to get lost in the details. This may be dangerous as it prevents you from understanding what is going on in your cluster in the macro scale.
You can prevent this by taking a holistic approach and considering the cluster as a whole. Pay attention to the interactions between different components and their impact on the overall performance and stability of the cluster. By considering the cluster as a unified entity, you can identify potential bottlenecks or points of failure that may affect the entire system. This approach allows you to make informed decisions and take necessary actions to ensure the trouble-free functioning of your Kubernetes cluster.
To keep you on track with the macro scale of your cluster and not get lost in the details, here is an overview of Kubernetes troubleshooting:
Kubernetes Troubleshooting – The Complete Guide
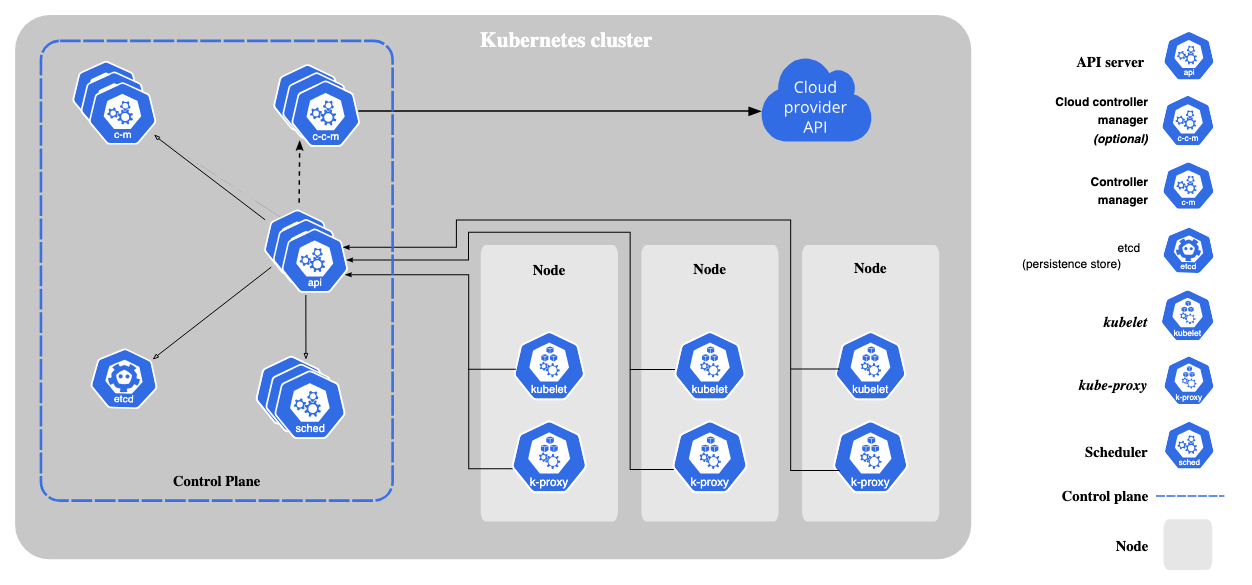
An Example Kubernetes Structure
Conclusion
Effective monitoring of your Kubernetes cluster is essential for maintaining its health, performance, and stability. With these 5 tips:
- Defining relevant metrics and alerts
- Choosing the right monitoring tools
- Regularly checking logs
- Identifying patterns
- Taking a holistic approach
You can ensure the optimal functioning of your cluster and proactively address any issues that may arise. By implementing these best practices, you can optimize the performance of your cluster, enhance the reliability of your applications, and provide a seamless experience for your users. If you are curious about Kubernetes and want to learn more about it, you can check it out here.
Happy monitoring!
References
- https://github.com/ddosify/ddosify
- https://kubernetes.io/docs/home/
- https://grafana.com/docs/grafana/latest/
- https://prometheus.io/docs/introduction/overview/
- https://docs.sysdig.com/en/
- https://github.com/kubernetes/kube-state-metrics
Share on social media: