In this blog, we'll demonstrate how eBPF can be practically used for function tracing. eBPF is increasingly important in the field of application observability and is viewed as the future of application performance monitoring. One of the key advantages of eBPF is that it doesn't require modifying your kernel or loading kernel modules, nor does it necessary to instrument your service code for observability.
We'll begin by covering the basics of eBPF and uprobes. Following that, we'll apply these concepts in a real-world example. This approach mirrors the techniques used by Ddosify's eBPF Agent, Alaz, for monitoring traffic in Kubernetes clusters. All the source codes referenced in this article are available here.
Prerequisites
- Go for attaching our eBPF program to kernel.
- Clang for compiling our eBPF program.
- Linux machine to work on.
What is Function Tracing?
Function tracing is a technique used in software performance analysis to monitor and record the execution of functions or methods within a program. It involves tracking the entry and exit points of functions, along with relevant contextual information, to gain insights into the program's runtime behavior.
Function tracing is a powerful tool for debugging, profiling, and performance optimization. It can help identify bottlenecks, measure execution times, and analyze the flow of control within a program. Check out this article for more information on function tracing.
What is eBPF?
eBPF (extended Berkeley Packet Filter) is a revolutionary technology originating from the Linux kernel. It allows sandboxed programs to run in privileged contexts, such as the operating system kernel, enabling the extension of kernel capabilities safely and efficiently without modifying kernel source code or loading kernel modules.*
Basically, eBPF is a super-power given at your hands and its safe due to the existence of verifier. Before an eBPF program is allowed to run in the kernel, the verifier ensures that it will not crash the kernel. For more information about eBPF verifier, refer to the official documentation.
eBPF permits hooking into almost any execution point to perform tasks such as collecting metrics, traces, and conducting security checks.
eBPF programs can be attached to various points, including kprobes, tracepoints, and uprobes. Let's take a closer look at these.
Kprobes and Tracepoints
Kprobes, short for Kernel Probes, enables developers to insert probes into the kernel code at runtime. These probes can be attached to specific kernel functions or even to individual instructions. For more information, refer to the official documentation.
Tracepoints are static markers embedded within the Linux kernel code at specific locations. They serve as predefined points of interest, recording events for later analysis. Tracepoints are generally more reliable than kprobes, as kprobes may require maintenance across different kernel versions. For more information, refer to the official documentation.
You can use tracepoints to track the entry and exit of commonly used system calls, such as:
tracepoint/syscalls/sys_enter_write
tracepoint/syscalls/sys_exit_write
or to track socket states
tracepoint/sock/inet_sock_set_state
A list of available tracepoints can be found in this directory: /sys/kernel/debug/tracing/events/
Uprobes
Unlike kprobes or tracepoints, uprobes focus on user-space instrumentation. They allow for the insertion of probes into user-space applications, rather than kernel code. Uprobes can be attached to user-space functions; when these functions are executed, the associated probe handlers are triggered. For example, you can attach a probe to a function in a Go program and track how many times it is called.
Uprobes enable the dynamic instrumentation and observation of user-space program behavior by attaching eBPF handlers to any memory address, typically the entry point of a function. For more information, refer to the official documentation.
Let's Dive In !
Our example involves a user-space program calling a function with randomized parameters. Our eBPF program will track how many times each parameter is called.
User Program
//go:noinline
func Greet(name string) {
    fmt.Println("Hello, " + name)
}

func main() {
    names := []string{"Mauro", "Lucas", "Kerem"}
    tick := time.Tick(1 * time.Second)

    for range tick {
        Greet(names[rand.Intn(len(names))])
    }
}
Notice the go:noinline comment, which instructs the compiler to avoid inlining the function. Since this is a simple program, the compiler would otherwise inline the function, making the function symbol invisible in the ELF(Executable and Linkable Format) binary.
We compile our program with the simple command go build. We'll then run the compiled binary in a demo and expect it to be traced by our eBPF program.
Finding the Attachment Point
To trace the function, we need its symbol. Although it's also possible to trace direct memory addresses, we'll demonstrate using the function symbol for simplicity.
To find the function symbol, tools such as nm or objdump can be used."
nm exe | grep Greet
000000000048f240 T main.Greet
The address and the symbol of the Greet function can be seen at the nm response. We'll use the symbol to attach our uprobe handler later.
eBPF Program
Our eBPF program is split into two sections. Kernel side and user-space side.
The kernel side of our eBPF program is where the actual data collection takes place. This part of the program operates within the kernel space, gathering data as specified by the eBPF program's instructions.
The user-space side of the program is responsible for loading the eBPF program into the kernel. After the data is collected by the kernel side of the eBPF program, it is sent back to the user-space. In user-space, this data is accessed through eBPF maps and then processed as needed.
Kernel-space
eBPF maps are used to transfer data collected in the kernel to user space. For more information about eBPF maps, you can refer to the kernel docs.
Below, we declare the map and the event that will be sent to the user-space program for further analysis.
struct greet_event {
    char param[6];
};

struct {
    __uint(type, BPF_MAP_TYPE_RINGBUF);
    __uint(max_entries, 256 * 1024);
} greet_params SEC(".maps");
This uprobe handler that will be triggered on each Greet function invocation. Go keeps function parameters at registers, and we capture the function parameter that we are going to count with the help of GO_PARAM1 macro.
SEC("uprobe/go_test_greet")
int BPF_UPROBE(go_test_greet) {
    struct greet_event *e;

    /* reserve sample from BPF ringbuf */
    e = bpf_ringbuf_reserve(&greet_params, sizeof(*e), 0);
    if (!e)
        return 0;

    /* fill in event data */
    bpf_probe_read_str(&e->param, sizeof(e->param), (void*)GO_PARAM1(ctx));

    bpf_ringbuf_submit(e, 0);
    return 0;
}
This example program is written for the x86 architecture. If you want to run it on an ARM architecture, modifications to the GO_PARAM1 macro are necessary.
We compile our program into BPF bytecode using clang:
> clang -target bpf -O2 -g -o tracker.o -c bpf.c
The resulting tracker.o contains the compiled BPF bytecode, which will be loaded into the kernel by our user-space program in the following section.
User-space
The user-space program is responsible for loading the BPF bytecode into the kernel and reading data from the BPF maps populated by our uprobe handler. We use Cilium's eBPF library for this.
// load bpf bytecode to kernel
coll, err := ebpf.LoadCollection("tracker.o")

// attach uprobe to function symbol
_,_ = ex.Uprobe("main.Greet", coll.Programs["go_test_greet"], &link.UprobeOptions{})

// create a map reader
greetEvents, err := ringbuf.NewReader(coll.Maps["greet_params"])

// to read the upcoming bpf event
event, err := greetEvents.Read()
Demo
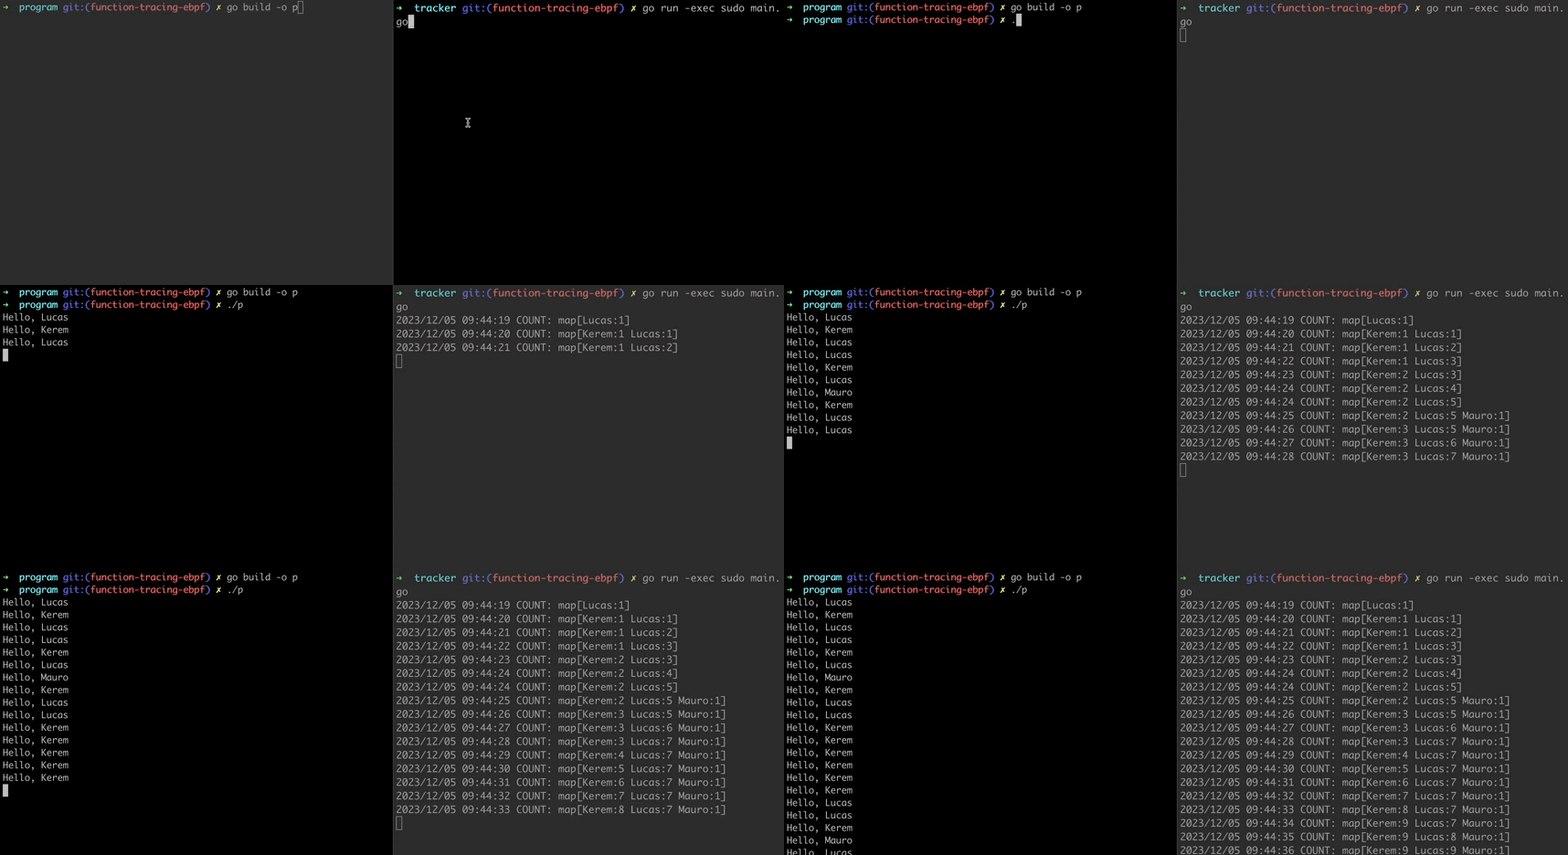
On the left terminal, our example program runs and every second it selects a random name and greets.
On the right, our eBPF program runs and traces the Greet function. Keeping track of the invocation times of the function parameters and listing them on console.

Code for example programs can be found at here.
Conclusion
In this article, we've leveraged the power of eBPF to trace a function in our Go program. We've only just begun to scratch the surface in this blog post. In Episode 2, I plan to delve deeper into uprobe topics, including attaching directly to instructions and the return points of functions.
On the Ddosify Platform, our eBPF Agent, Alaz, utilizes eBPF to gather insights and collect observability data from Kubernetes clusters. The technique demonstrated in this blog is actually employed in capturing encrypted traffic. Don't forget to drop a star and feel free to ask your questions on any platform!
Share on social media:
