

In 2023, customers prioritize tools that offer comprehensive insights into both frontend and backend performance, seamless integrations into existing workflows, and a proactive approach to issue resolution. The industry trends lean towards user-centric monitoring, continuous performance optimization, and the integration of performance monitoring into the broader development lifecycle. Frontend performance monitoring remains a critical aspect of web development, ensuring optimal user experiences. Several tools dominate the landscape, each catering to specific needs. Here's a brief overview of 10 popular frontend performance monitoring tools in 2023, considering general trends and customer preferences:
Table of Contents
- 1- Google PageSpeed Insights
- 2- WebPageTest
- 3- Pingdom
- 4- New Relic Browser
- 5- Sentry
- 6- SpeedCurve
- 7- Dynatrace
- 8- AppDynamics
- 9- GTmetrix
- 10- Raygun Real User Monitoring
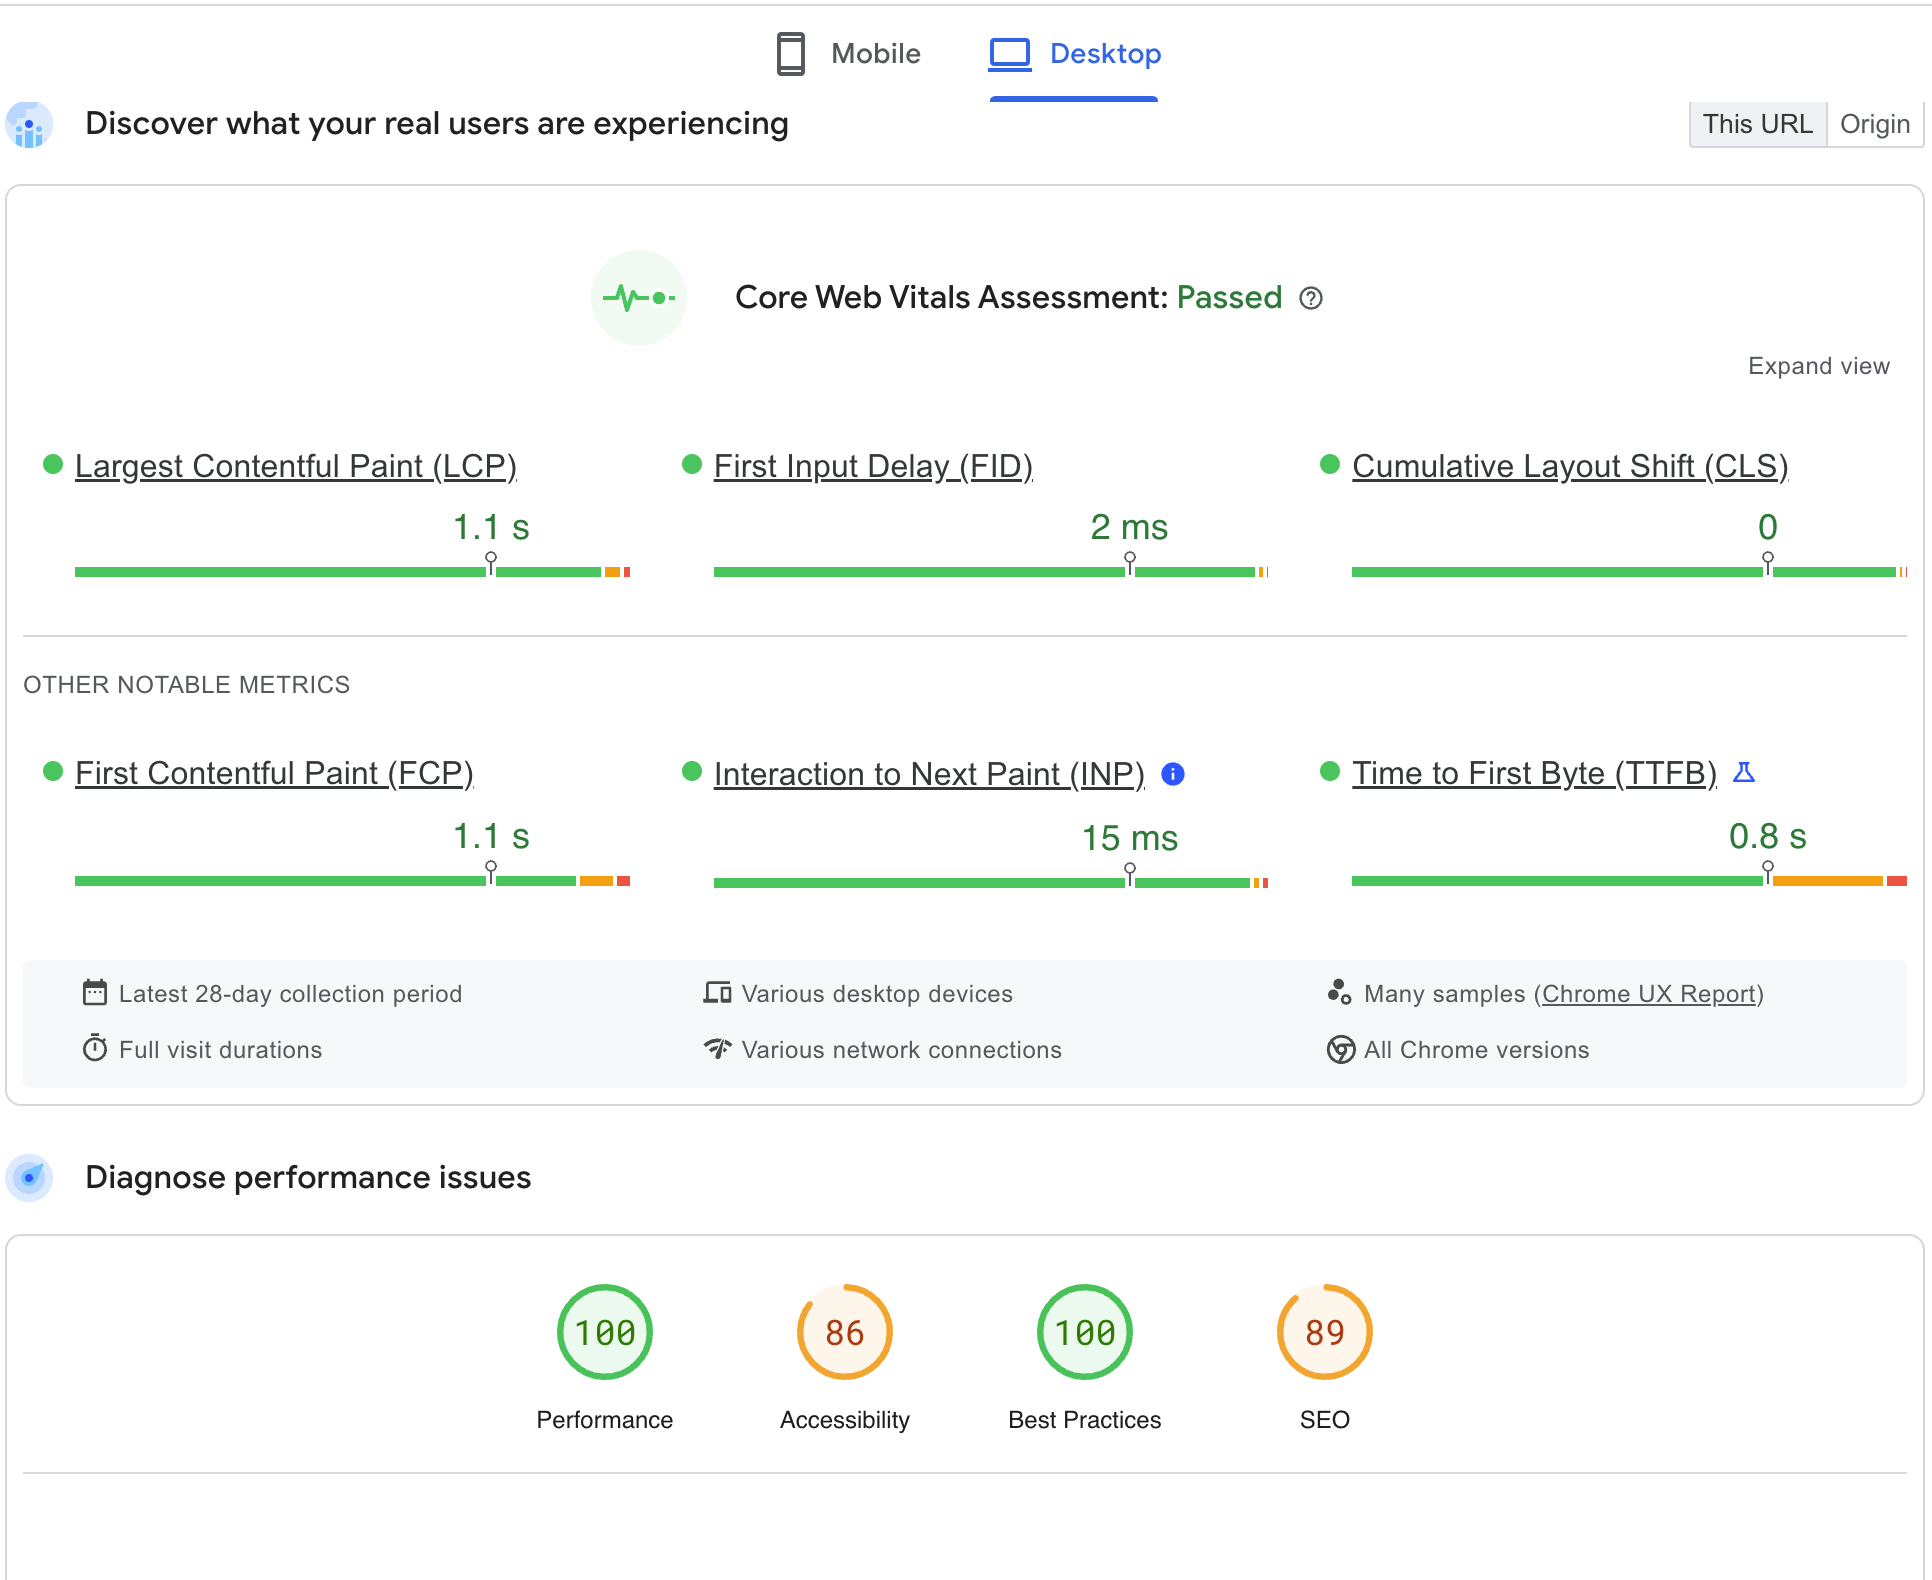
1- Google PageSpeed Insights
Google's PageSpeed Insights provides performance scores and actionable suggestions for optimizing web pages.
Key Features: Real-time analysis, mobile and desktop scores, and integration with Lighthouse.
Link for the product: https://pagespeed.web.dev/
Google PageSpeed Insights
✅ Pros
- ✅ Free to Use: Google PageSpeed Insights is free and accessible to anyone, making it a cost-effective option for small to large businesses.
- ✅ Actionable Recommendations: Provides actionable insights and recommendations to improve website performance. Suggestions cover various aspects like image optimization, script execution, and caching.
- ✅ Integration with Lighthouse: PageSpeed Insights is powered by Lighthouse, an open-source, automated tool for improving the quality of web pages. This integration allows for in-depth audits and suggestions.
- ✅ Mobile and Desktop Scores: Provides separate scores for mobile and desktop performance, helping you understand and optimize for different user experiences.
- ✅ User Experience Metrics: Offers key user experience metrics, including First Contentful Paint (FCP), Largest Contentful Paint (LCP), and Cumulative Layout Shift (CLS).
- ✅ Field Data: Displays real-world performance data (field data) from users who have visited the website, offering insights into actual user experiences.
❌ Cons
- ❌ Limited Historical Data: PageSpeed Insights primarily focuses on real-time data and does not provide historical performance data.
- ❌ Limited Debugging Tools: While it provides high-level recommendations, it may not offer detailed debugging tools for diagnosing specific issues.
- ❌ Doesn't Cover All Aspects: Some advanced performance optimizations may not be covered by PageSpeed Insights, and additional tools may be required for in-depth analysis.
- ❌ May Lack Granularity: The tool provides overall scores and suggestions but may lack the granularity needed for detailed performance analysis.
💵 Pricing
Google PageSpeed Insights is free to use for everyone. There are no costs associated with running performance audits and receiving recommendations for improving website speed and user experience.
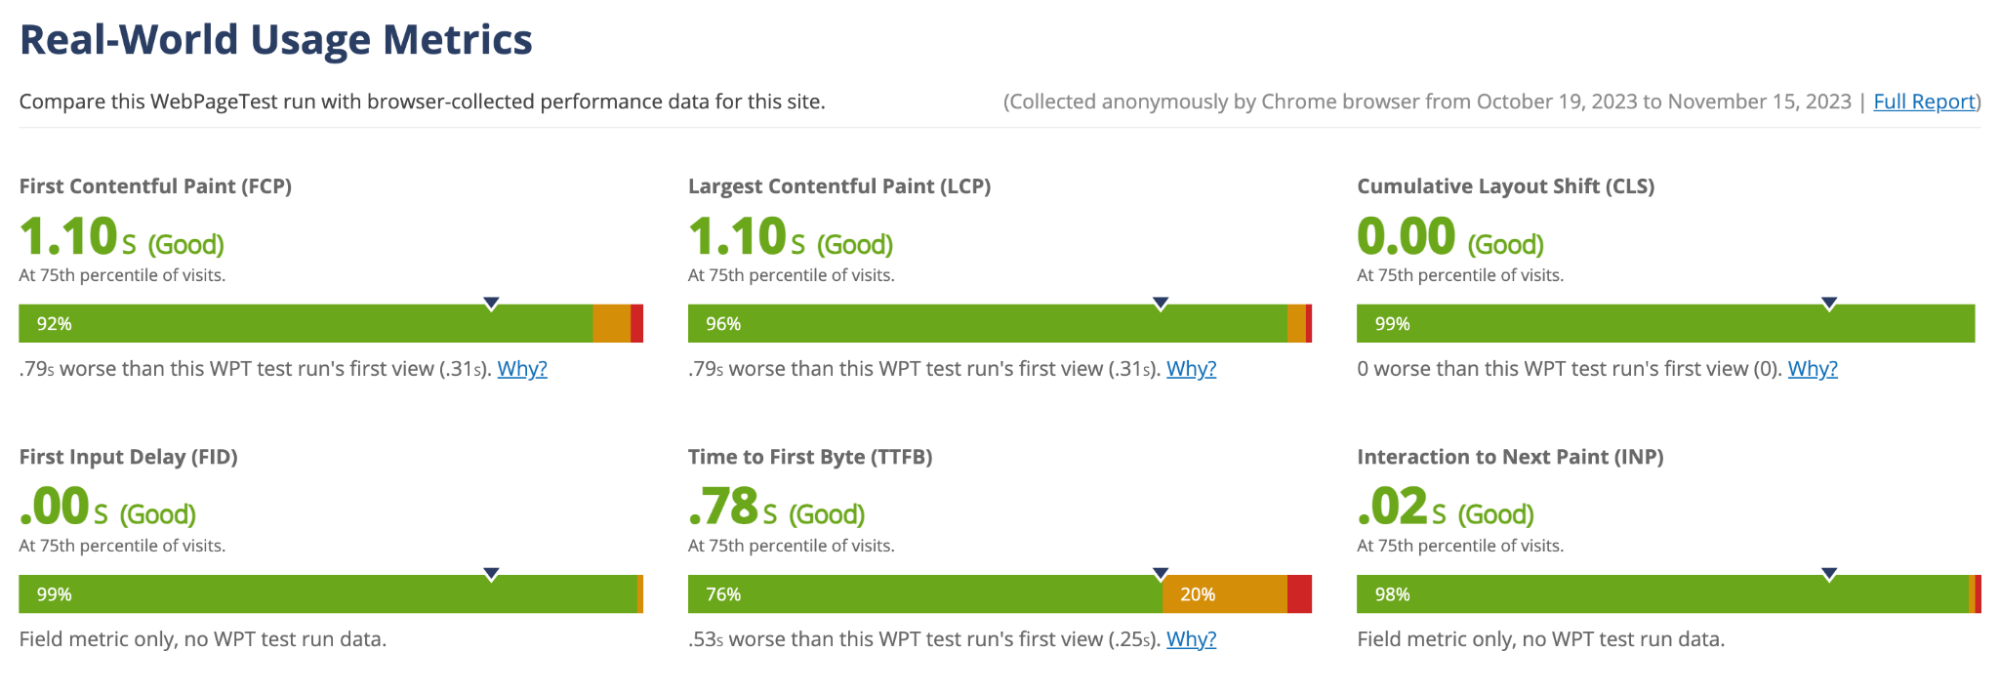
2- WebPageTest
WebPageTest is an open-source tool that offers detailed insights into various performance metrics, including load time and visualizations like waterfall charts.
Key Features: Geographical testing, mobile and desktop testing, and scripting for advanced scenarios.
Link for the product: https://www.webpagetest.org/
WebPageTest
✅ Pros
- ✅ Free and Open Source: WebPageTest is an open-source tool that offers a free, public instance for testing. Users can also set up their private instances for internal testing.
- ✅ Detailed Performance Metrics: Provides comprehensive details about various performance metrics, including load time, time to first byte (TTFB), start render, and more.
- ✅ Geographical Testing: Allows testing websites from multiple locations globally, helping to understand performance variances across different regions.
- ✅ Mobile and Desktop Testing: Supports both mobile and desktop testing, allowing users to analyze and optimize for different devices.
- ✅ Advanced Scripting: Offers scripting capabilities for advanced testing scenarios, including user interactions and complex workflows.
- ✅ Waterfall Charts and Filmstrip Views: Visualizes page loading with waterfall charts and filmstrip views, helping identify bottlenecks and resource loading sequences.
- ✅ Third-Party Content Analysis: Identifies and provides insights into third-party content that may impact page performance.
❌ Cons
- ❌ Steep Learning Curve: WebPageTest can be overwhelming for beginners due to its extensive feature set. Users may need some time to get familiar with all the available options.
- ❌ Infrastructure for Private Instances: Setting up and maintaining private instances requires infrastructure and technical expertise, making it less straightforward for smaller teams.
- ❌ Lack of Real-Time Monitoring: WebPageTest primarily focuses on individual performance tests and may not offer continuous or real-time monitoring capabilities.
💵 Pricing
WebPageTest Pricing
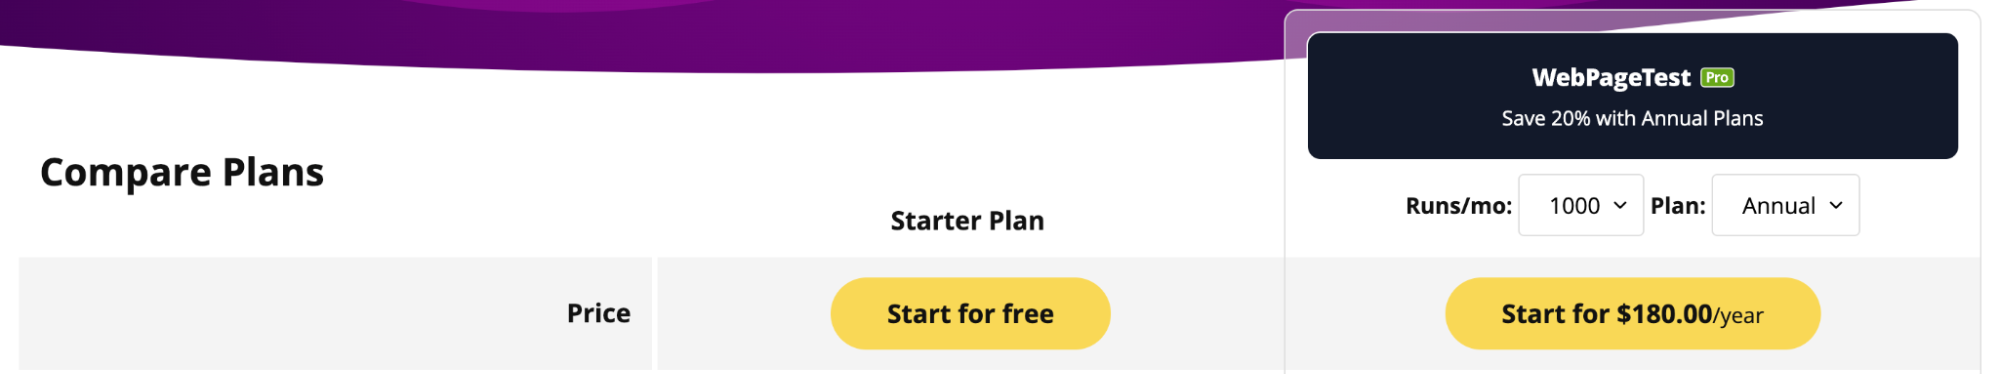
WebPageTest is free to use for public testing on the official website. For private instances, organizations need to set up and maintain their infrastructure, incurring costs for server resources and maintenance. Please investigate webpage for more pricing information.
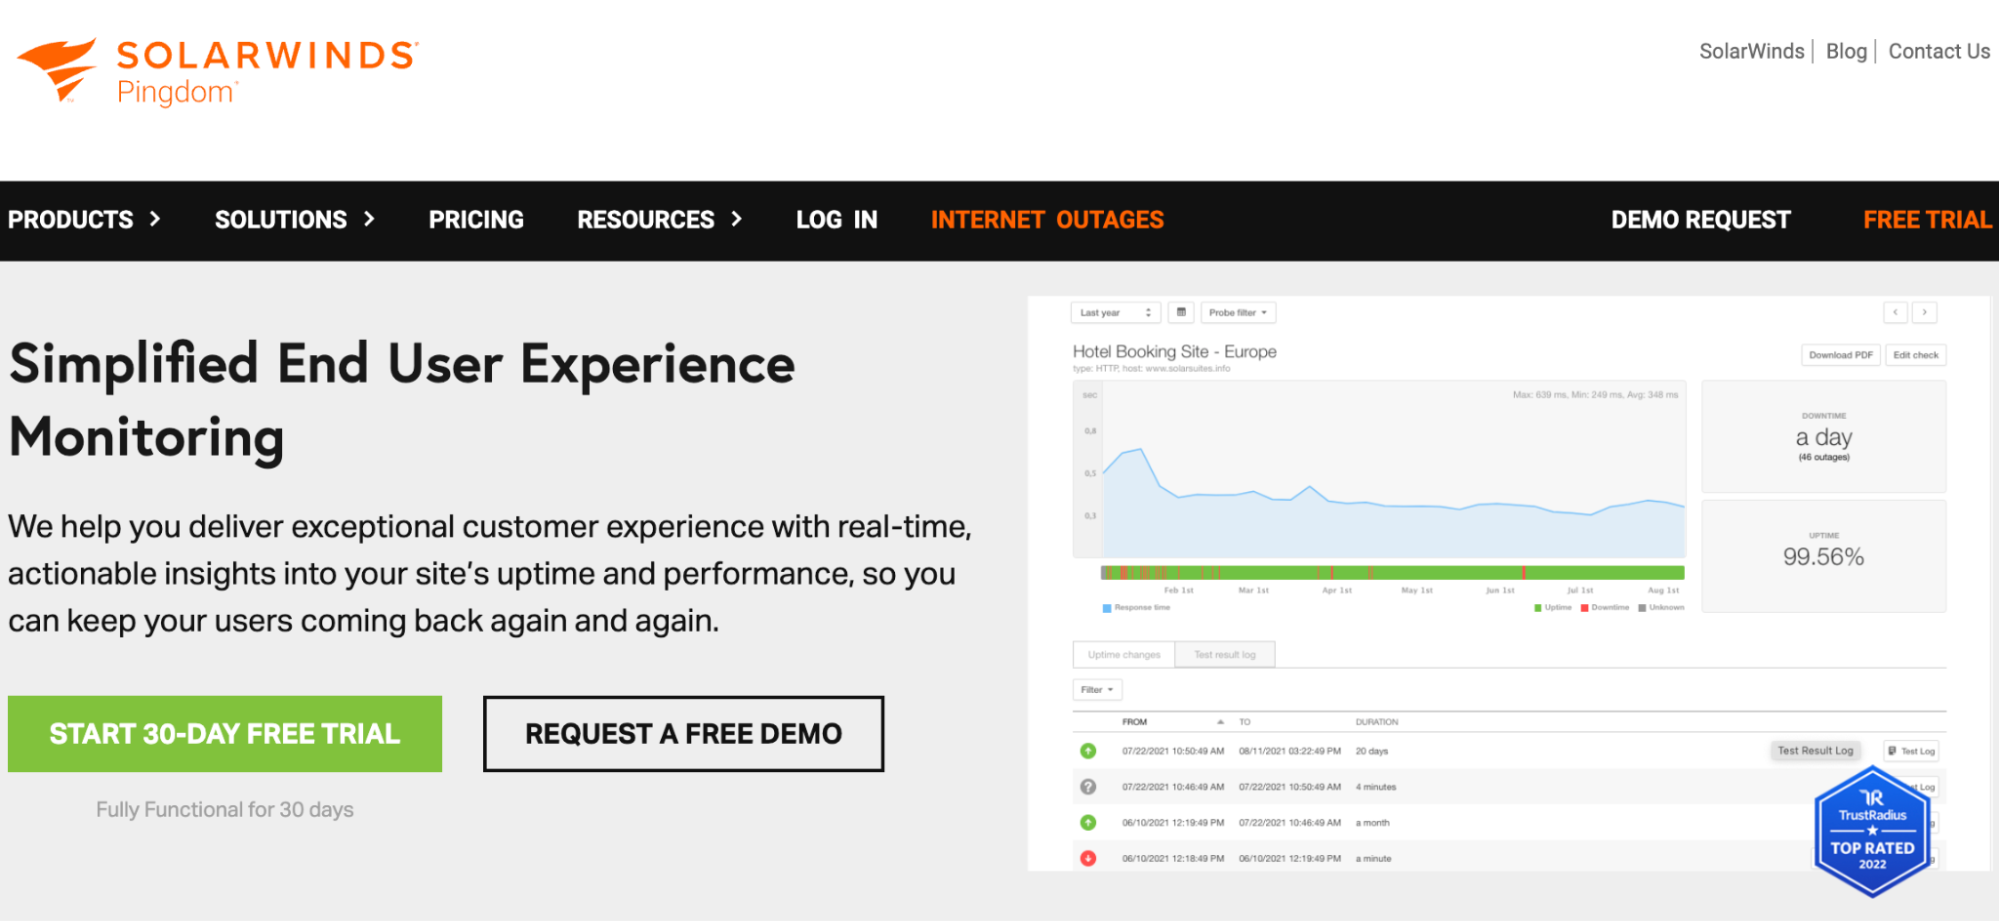
3- Pingdom
Pingdom is a real-time monitoring tool that provides insights into website availability and performance, along with alerts for downtime.
Key Features: Real-time monitoring, user-friendly interface, and historical data.
Link for the product: https://www.pingdom.com/
Pingdom
✅ Pros
- ✅ Real-Time Monitoring: Pingdom offers real-time monitoring of website performance, providing immediate alerts for downtime or performance issues.
- ✅ User-Friendly Interface: The tool is known for its user-friendly interface, making it accessible for users with varying levels of technical expertise.
- ✅ Alerting and Notifications: Pingdom provides customizable alerting features, allowing users to receive notifications via various channels (email, SMS, etc.) when performance thresholds are breached.
- ✅ Historical Data: Pingdom stores historical performance data, enabling users to track changes over time and identify patterns.
- ✅ Transaction Monitoring: Pingdom allows for transaction monitoring, enabling the simulation of user interactions to ensure critical workflows are functioning correctly.
- ✅ Global Test Locations: Offers testing from multiple locations around the world, helping to identify regional performance variations.
❌ Cons
- ❌ Pricing for Larger Organizations: The pricing structure might be a concern for larger organizations or websites with extensive monitoring needs.
- ❌ Limited Advanced Features: While Pingdom is robust for general monitoring, some users may find it lacks certain advanced features present in other tools.
💵 Pricing
Pingdom Pricing
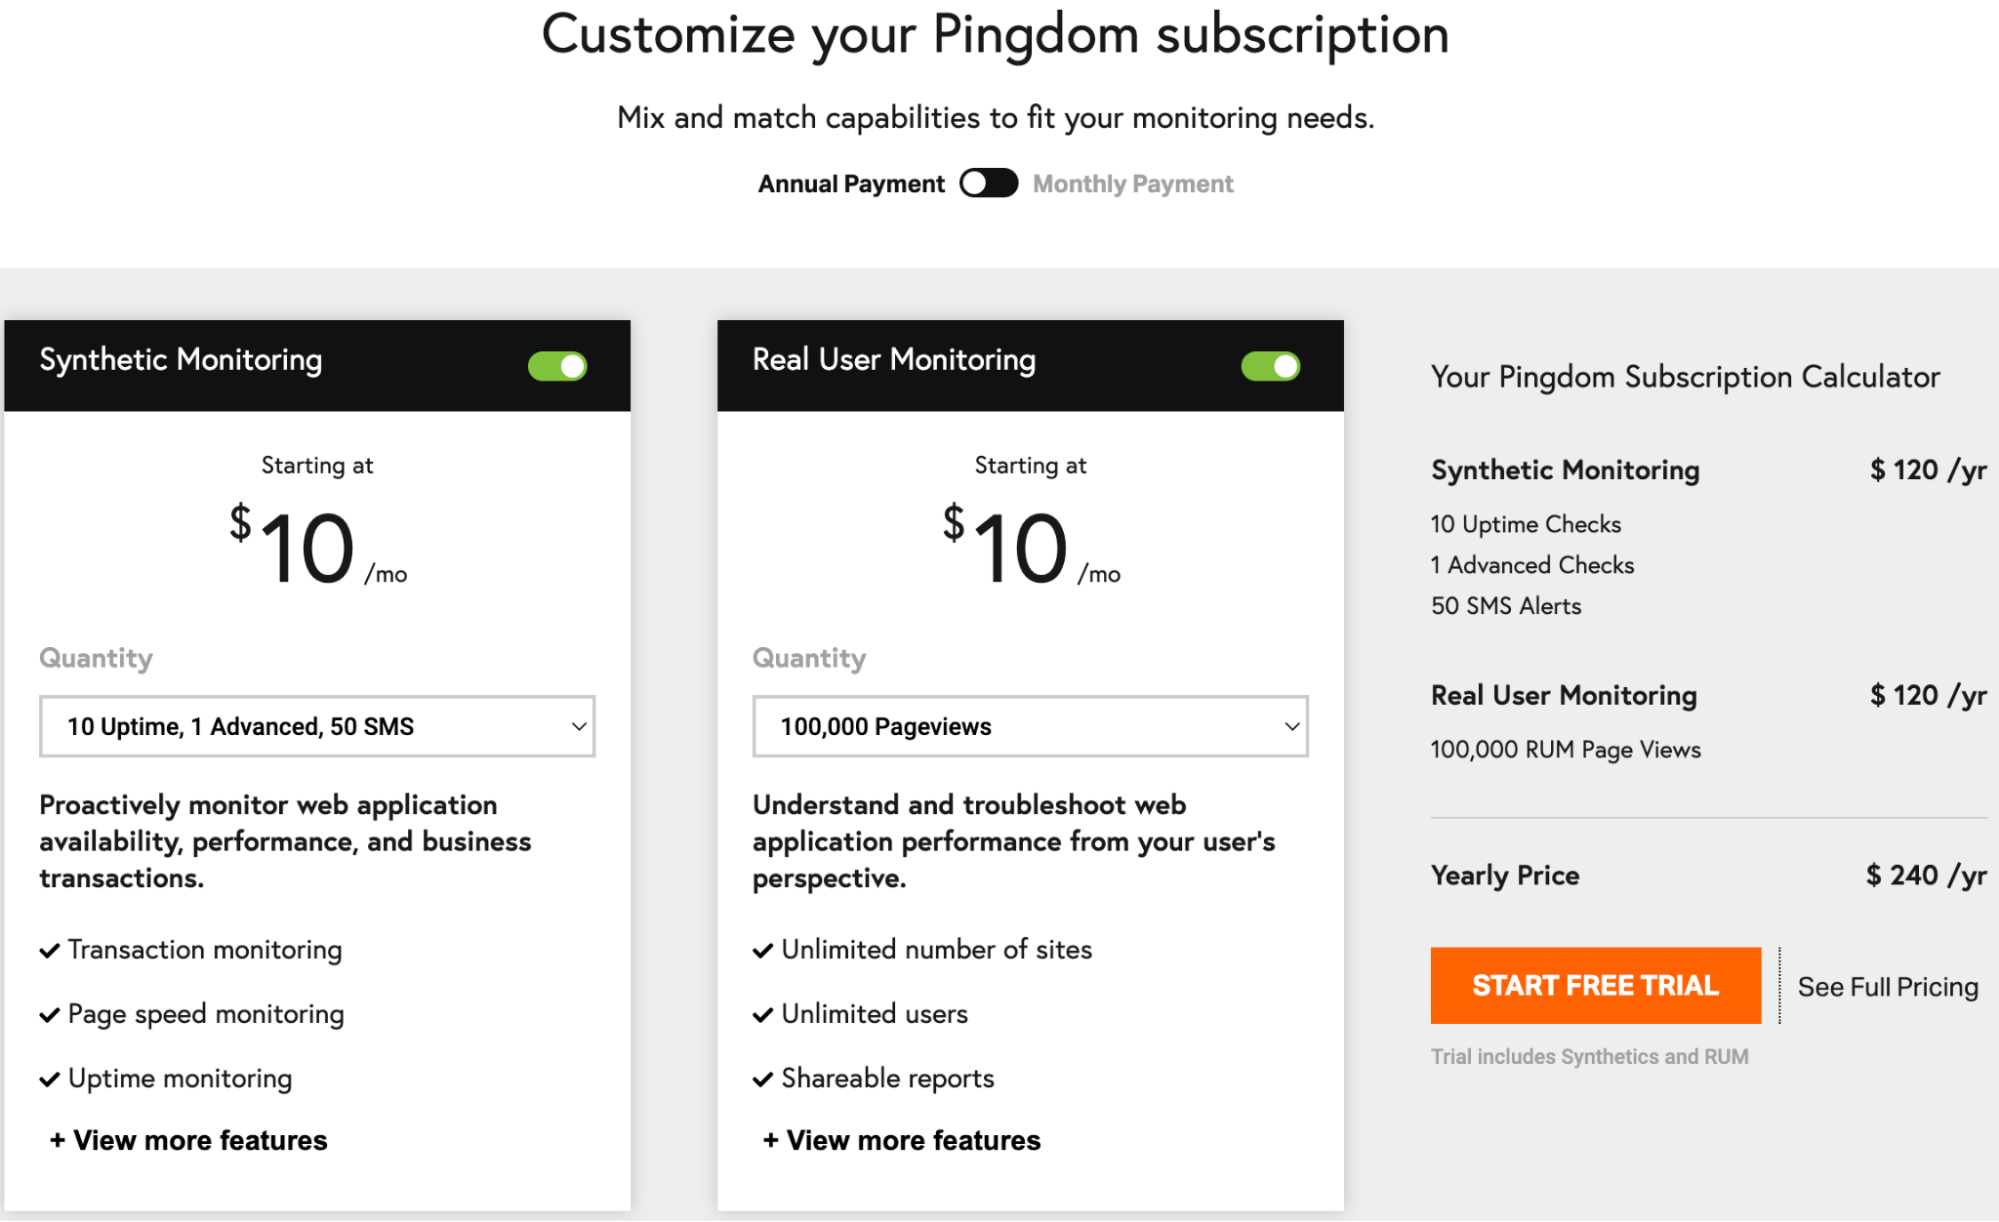
Pingdom offers various pricing plans based on the level of monitoring required. Plans may include different features such as the number of checks, alerting channels, and transaction monitoring capabilities.
- Free Trial: Pingdom typically offers a free trial period for users to test the service.
- Paid Plans: Paid plans are available with different tiers, catering to various levels of website monitoring needs. Pricing can range from a few dollars per month to higher amounts for larger plans with more features.
4- New Relic Browser
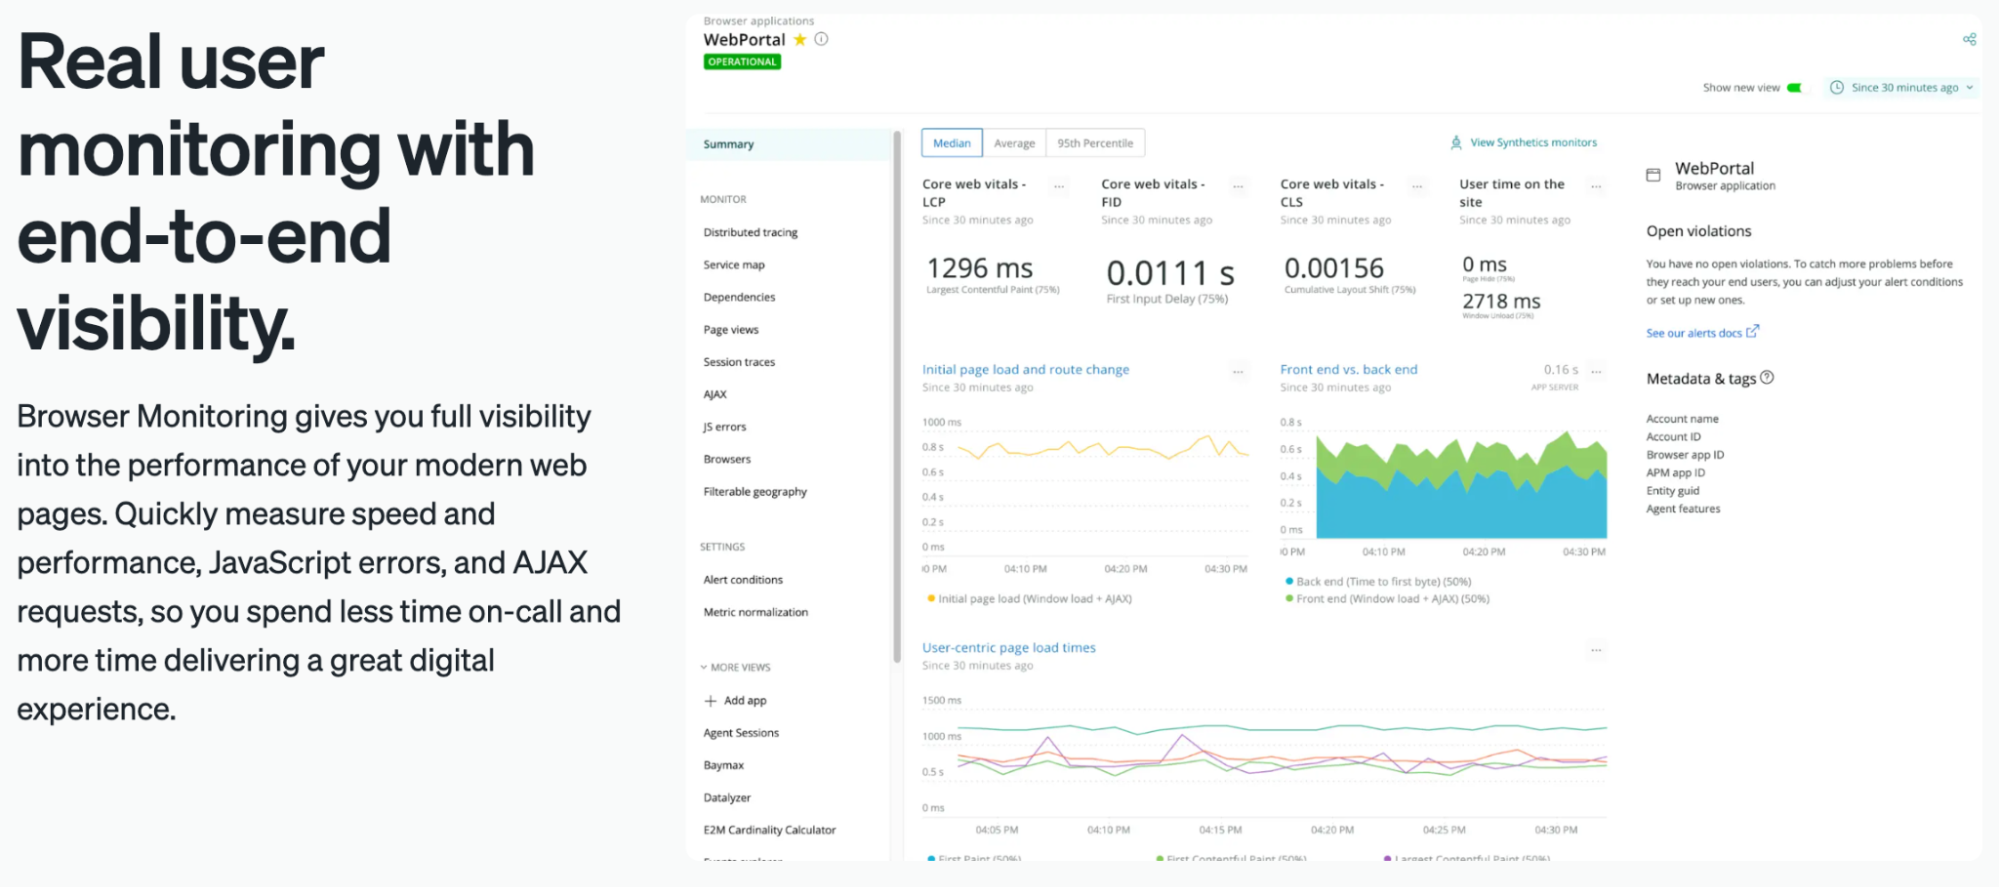
New Relic Browser offers real-time monitoring and analytics for frontend performance, with end-to-end visibility into the application stack.
Key Features: Real-time insights, transaction traces, and integration with other New Relic products.
Link for the product: https://newrelic.com
New Relic Browser
✅ Pros
- ✅ Real-Time Monitoring: New Relic Browser offers real-time monitoring of frontend performance, providing insights into page load times, user interactions, and errors.
- ✅ End-to-End Visibility: Provides end-to-end visibility into the entire application stack, allowing users to correlate frontend performance with backend services.
- ✅ Transaction Traces: Offers detailed transaction traces, helping identify performance bottlenecks and areas for improvement.
- ✅ Powerful Analytics: New Relic Browser provides powerful analytics for understanding user interactions, AJAX requests, and third-party services impacting page load times.
- ✅ Integration with Other New Relic Products: Integrates seamlessly with other New Relic products, creating a unified monitoring platform for full-stack visibility.
- ✅ Error Tracking: Monitors and reports frontend errors, helping developers quickly identify and resolve issues.
❌ Cons
- ❌ Pricing for Larger Organizations: New Relic's pricing structure may be a concern for larger organizations with extensive monitoring needs.
- ❌ Learning Curve: For new users, there might be a learning curve to fully leverage the tool's extensive feature set.
💵 Pricing
New Relic Browser Pricing
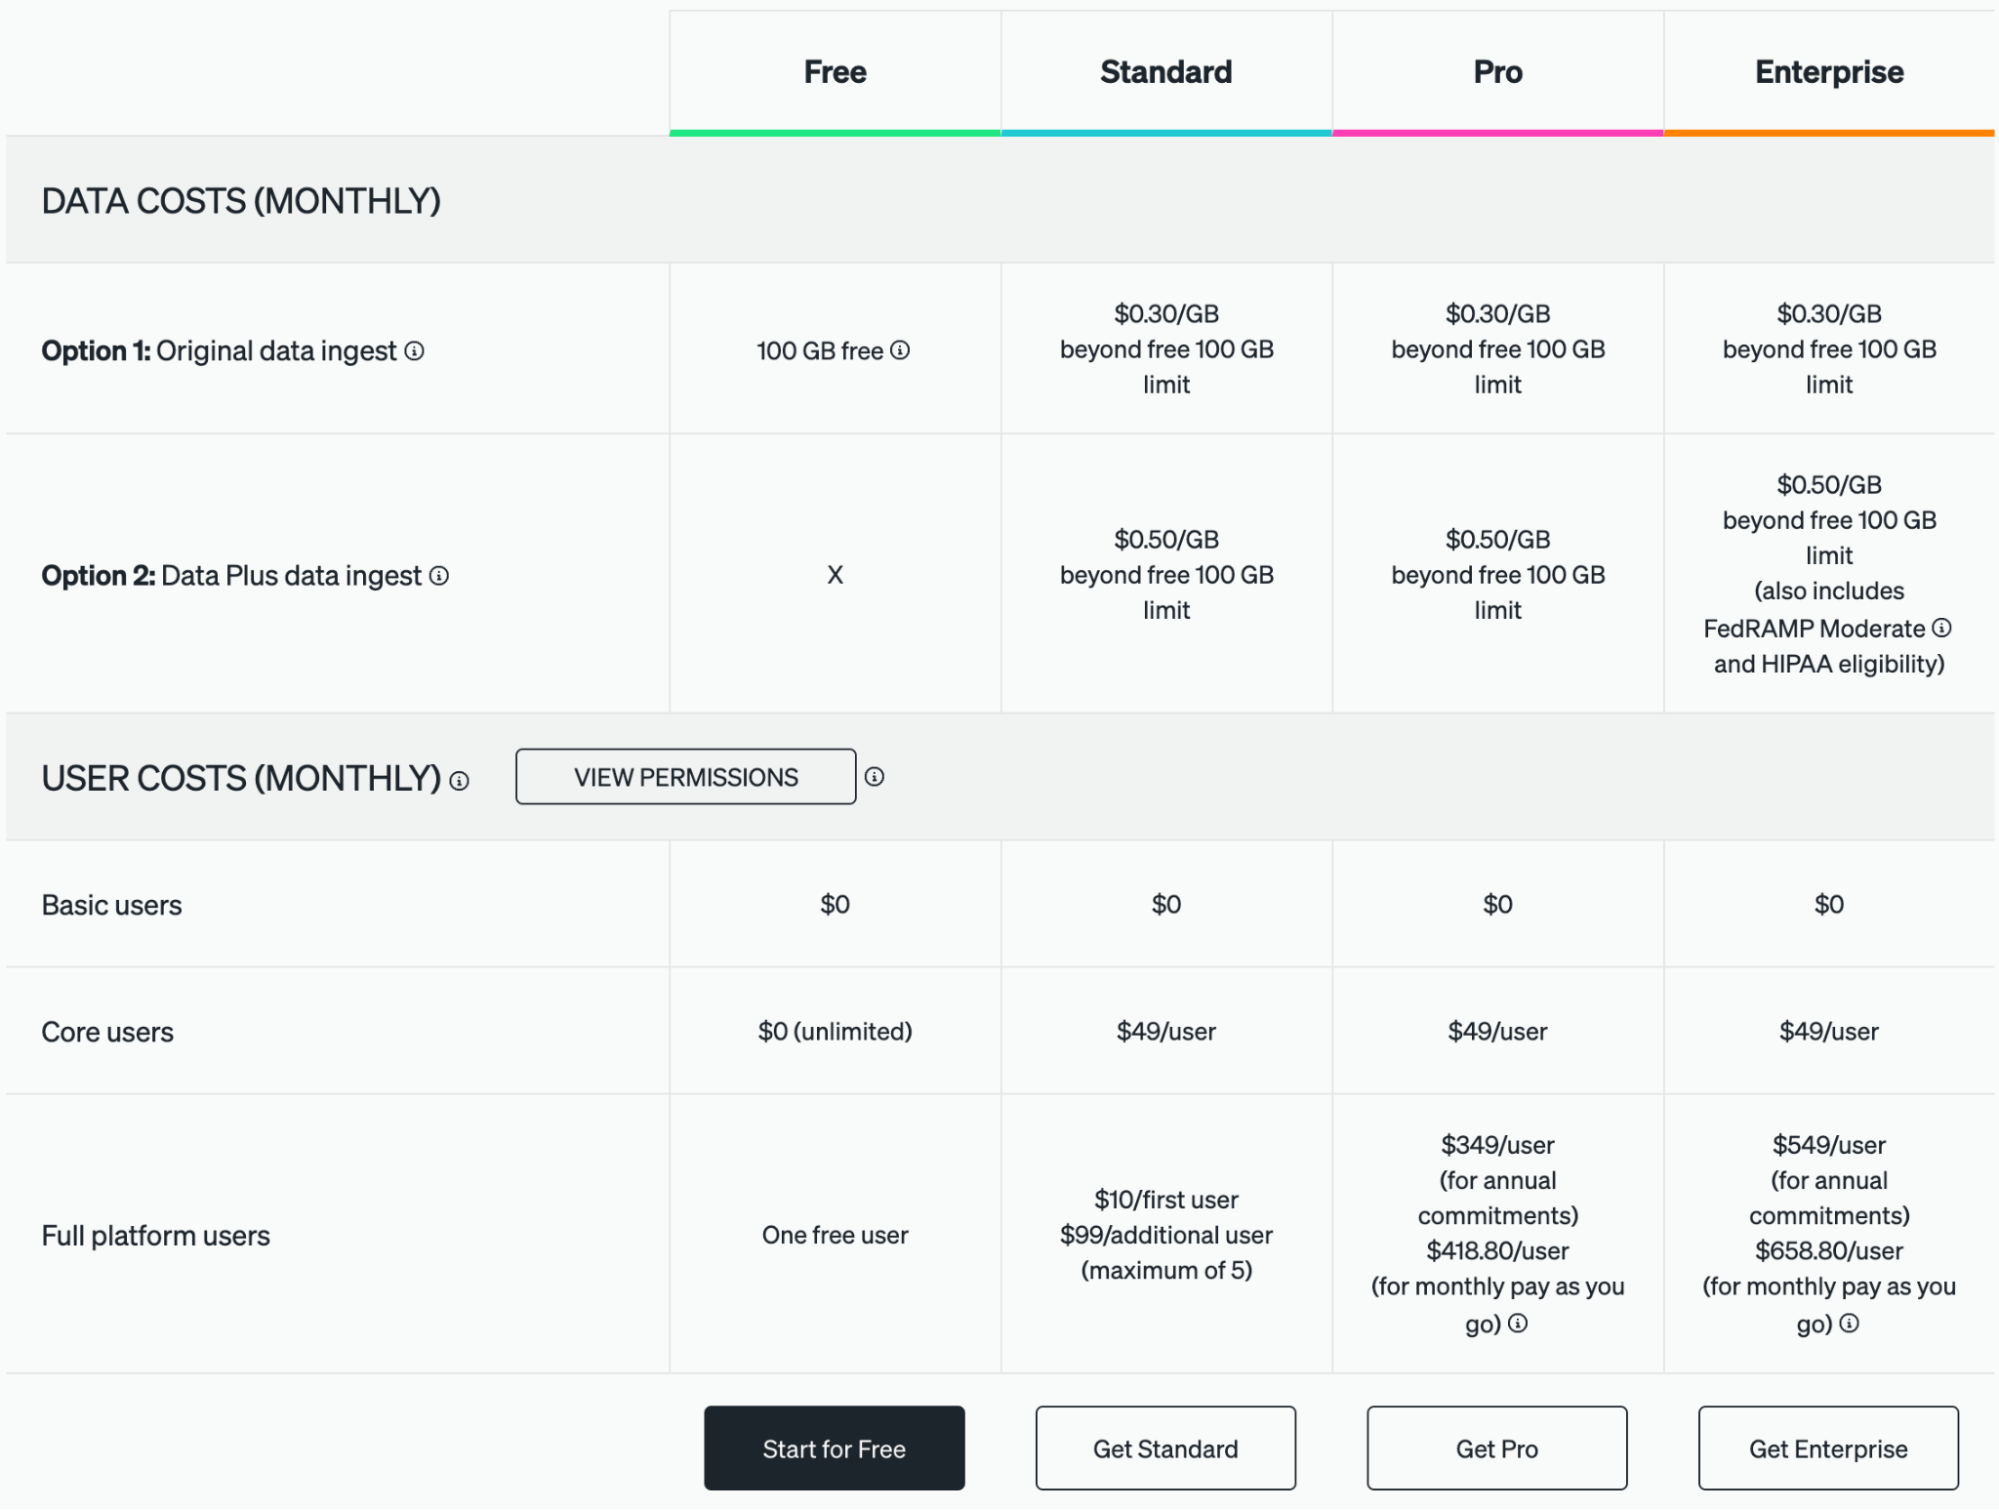
New Relic typically offers a subscription-based pricing model with different tiers, catering to various levels of monitoring needs. Pricing details may include factors such as the number of users, data retention, and additional features.
- Free Trial: New Relic often provides a free trial period for users to explore and test the service.
- Paid Plans: Paid plans vary based on the level of monitoring required, and pricing can range from a basic tier to higher amounts for larger plans with more features.
5- Sentry
While Sentry is renowned for error tracking, its inclusion of performance monitoring features provides a holistic approach. Developers appreciate the seamless integration of error and performance insights, streamlining issue resolution workflows.
Key Features: Performance monitoring, error and performance insights
Link for the product: https://sentry.io
Sentry
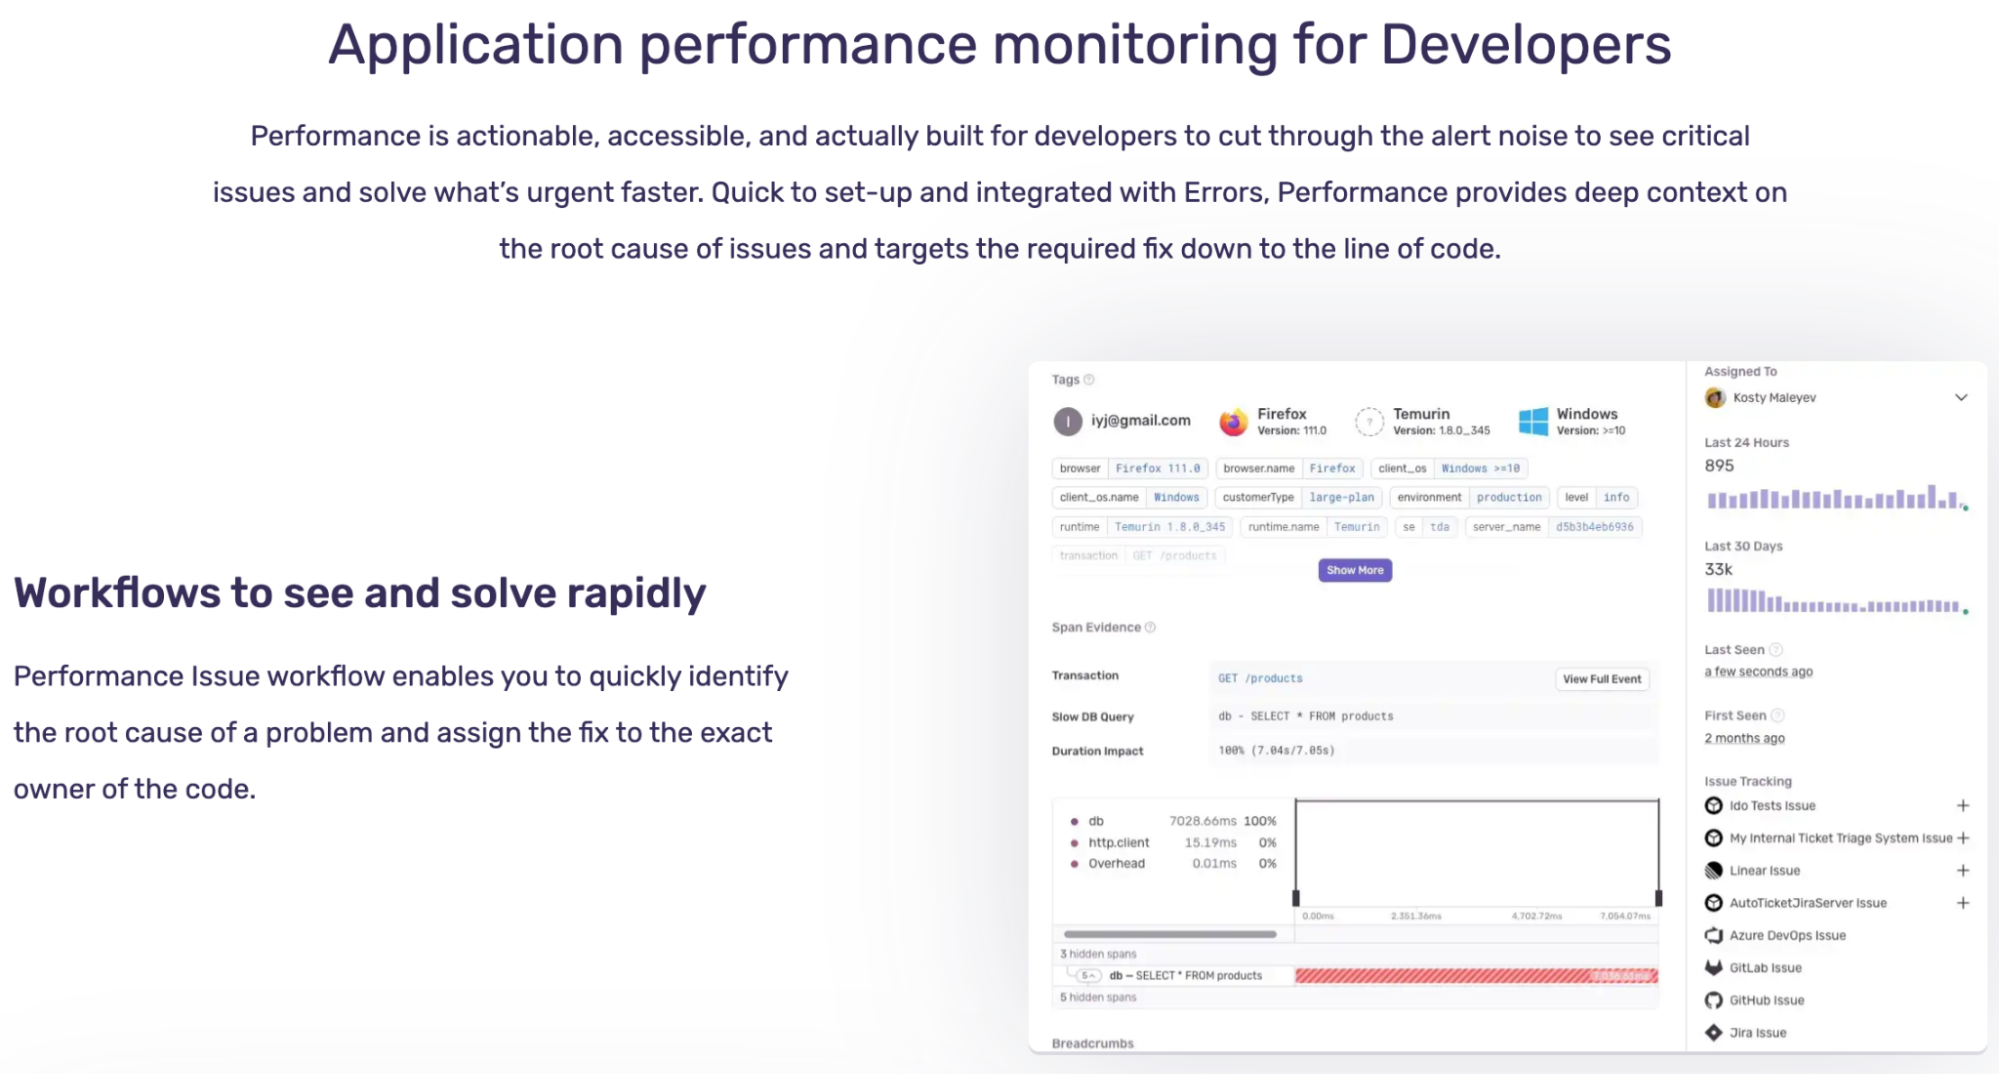
While Sentry does not specialize in frontend performance monitoring in the same way as some other tools, it does provide insights into the performance of your applications alongside its error tracking capabilities.
✅ Pros
- ✅ Error Tracking: Sentry is renowned for its error tracking capabilities, allowing developers to identify and resolve issues in real-time.
- ✅ Cross-Platform Support: Sentry supports multiple programming languages and frameworks, making it versatile for a variety of applications, including frontend and backend.
- ✅ Performance Monitoring: Sentry provides insights into application performance, including transaction traces and performance metrics, to help identify bottlenecks and areas for improvement.
- ✅ Open Source Core: Sentry offers an open-source core, allowing users to self-host if desired, providing greater control over the monitoring environment.
- ✅ Integrations: Integrates with a variety of popular development tools, issue trackers, and communication platforms.
- ✅ Alerting: Provides alerting features to notify development teams of critical errors or performance issues.
❌ Cons
- ❌ Focused on Error Tracking: While Sentry provides insights into performance, it is primarily known for error tracking, and users seeking dedicated frontend performance monitoring features may explore other tools.
- ❌ Learning Curve: For new users, there may be a learning curve, particularly in configuring and optimizing the tool for specific use cases.
- ❌ Pricing for Larger Organizations: Pricing might be a concern for larger organizations with extensive monitoring needs.
💵 Pricing
Sentry Pricing
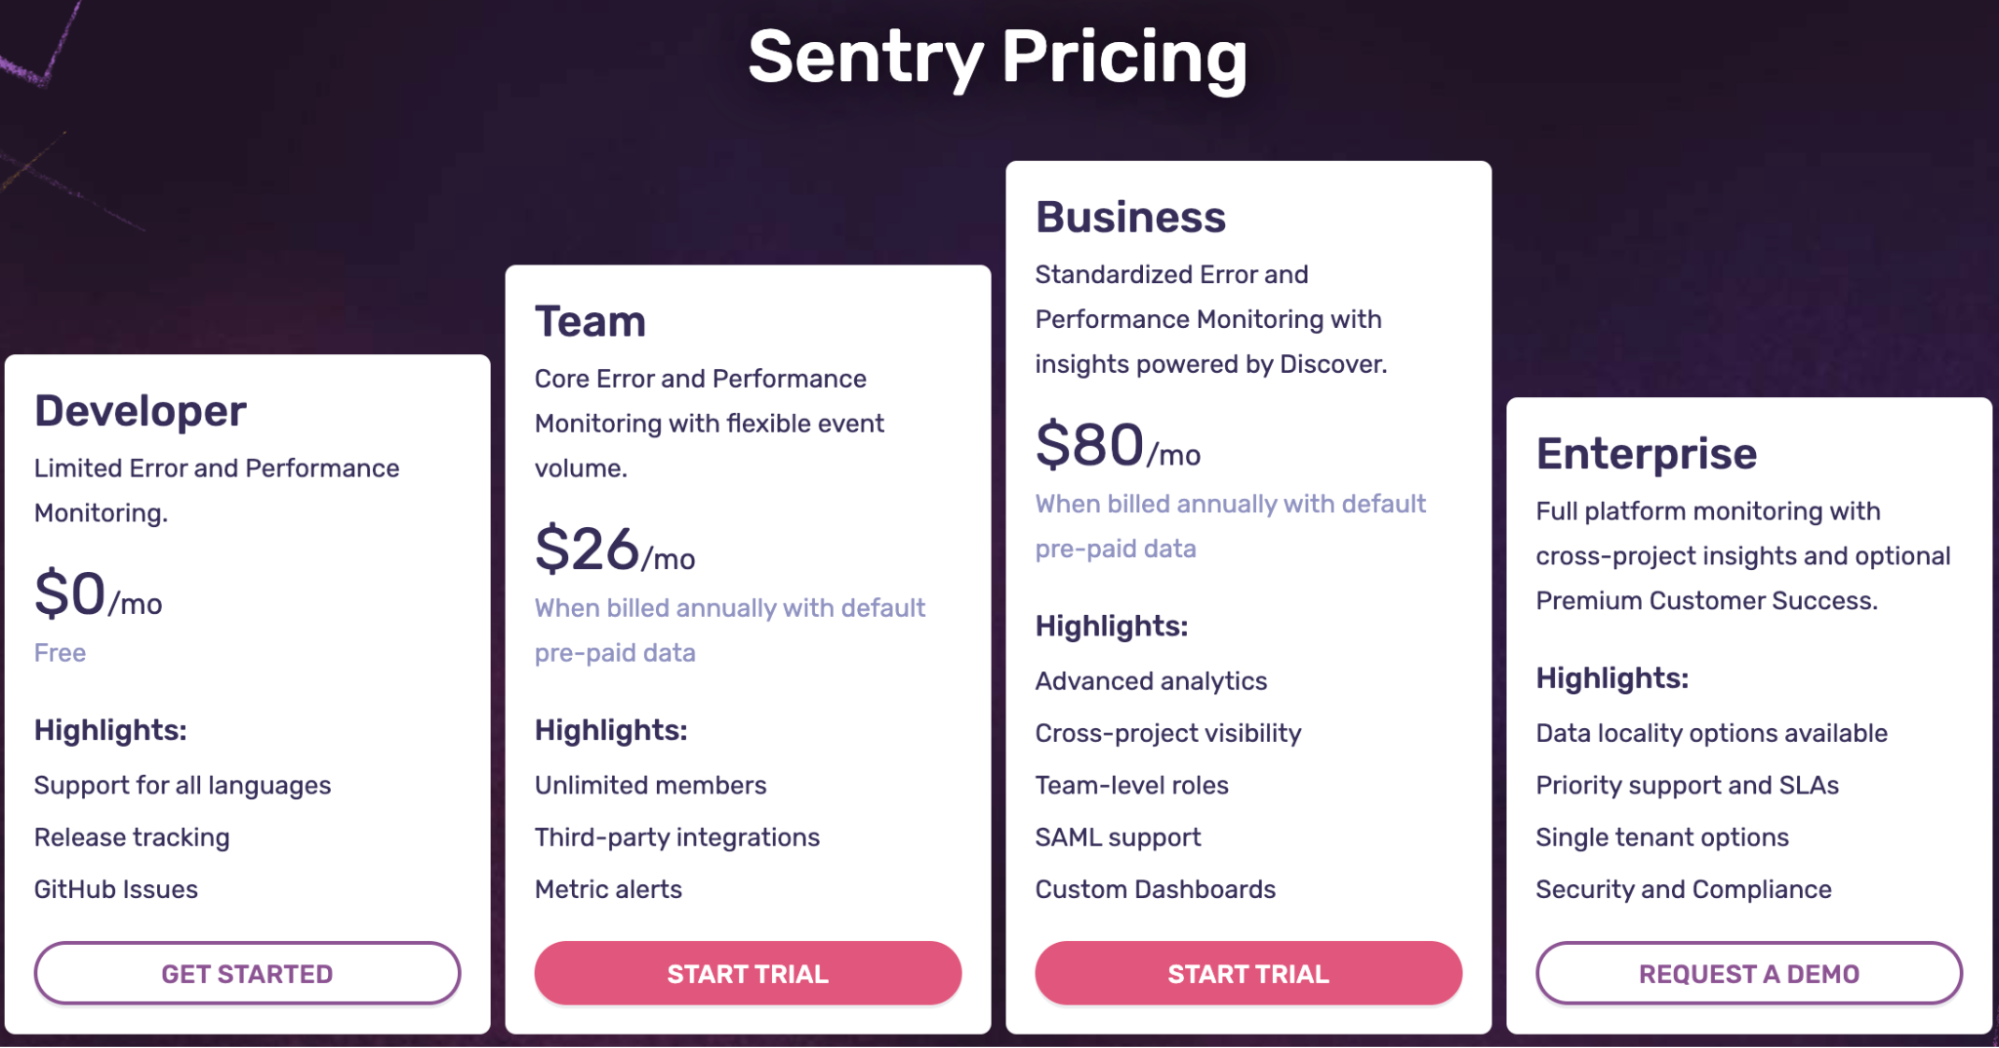
Sentry offers a variety of pricing plans, including a free tier for smaller teams and projects. Pricing typically depends on factors such as the number of events or errors processed, data retention, and additional features.
- Free Tier: A free tier is available with basic features for small projects.
- Paid Plans: Paid plans cater to larger teams and organizations with more extensive monitoring requirements. Pricing is often tiered based on the volume of events processed.
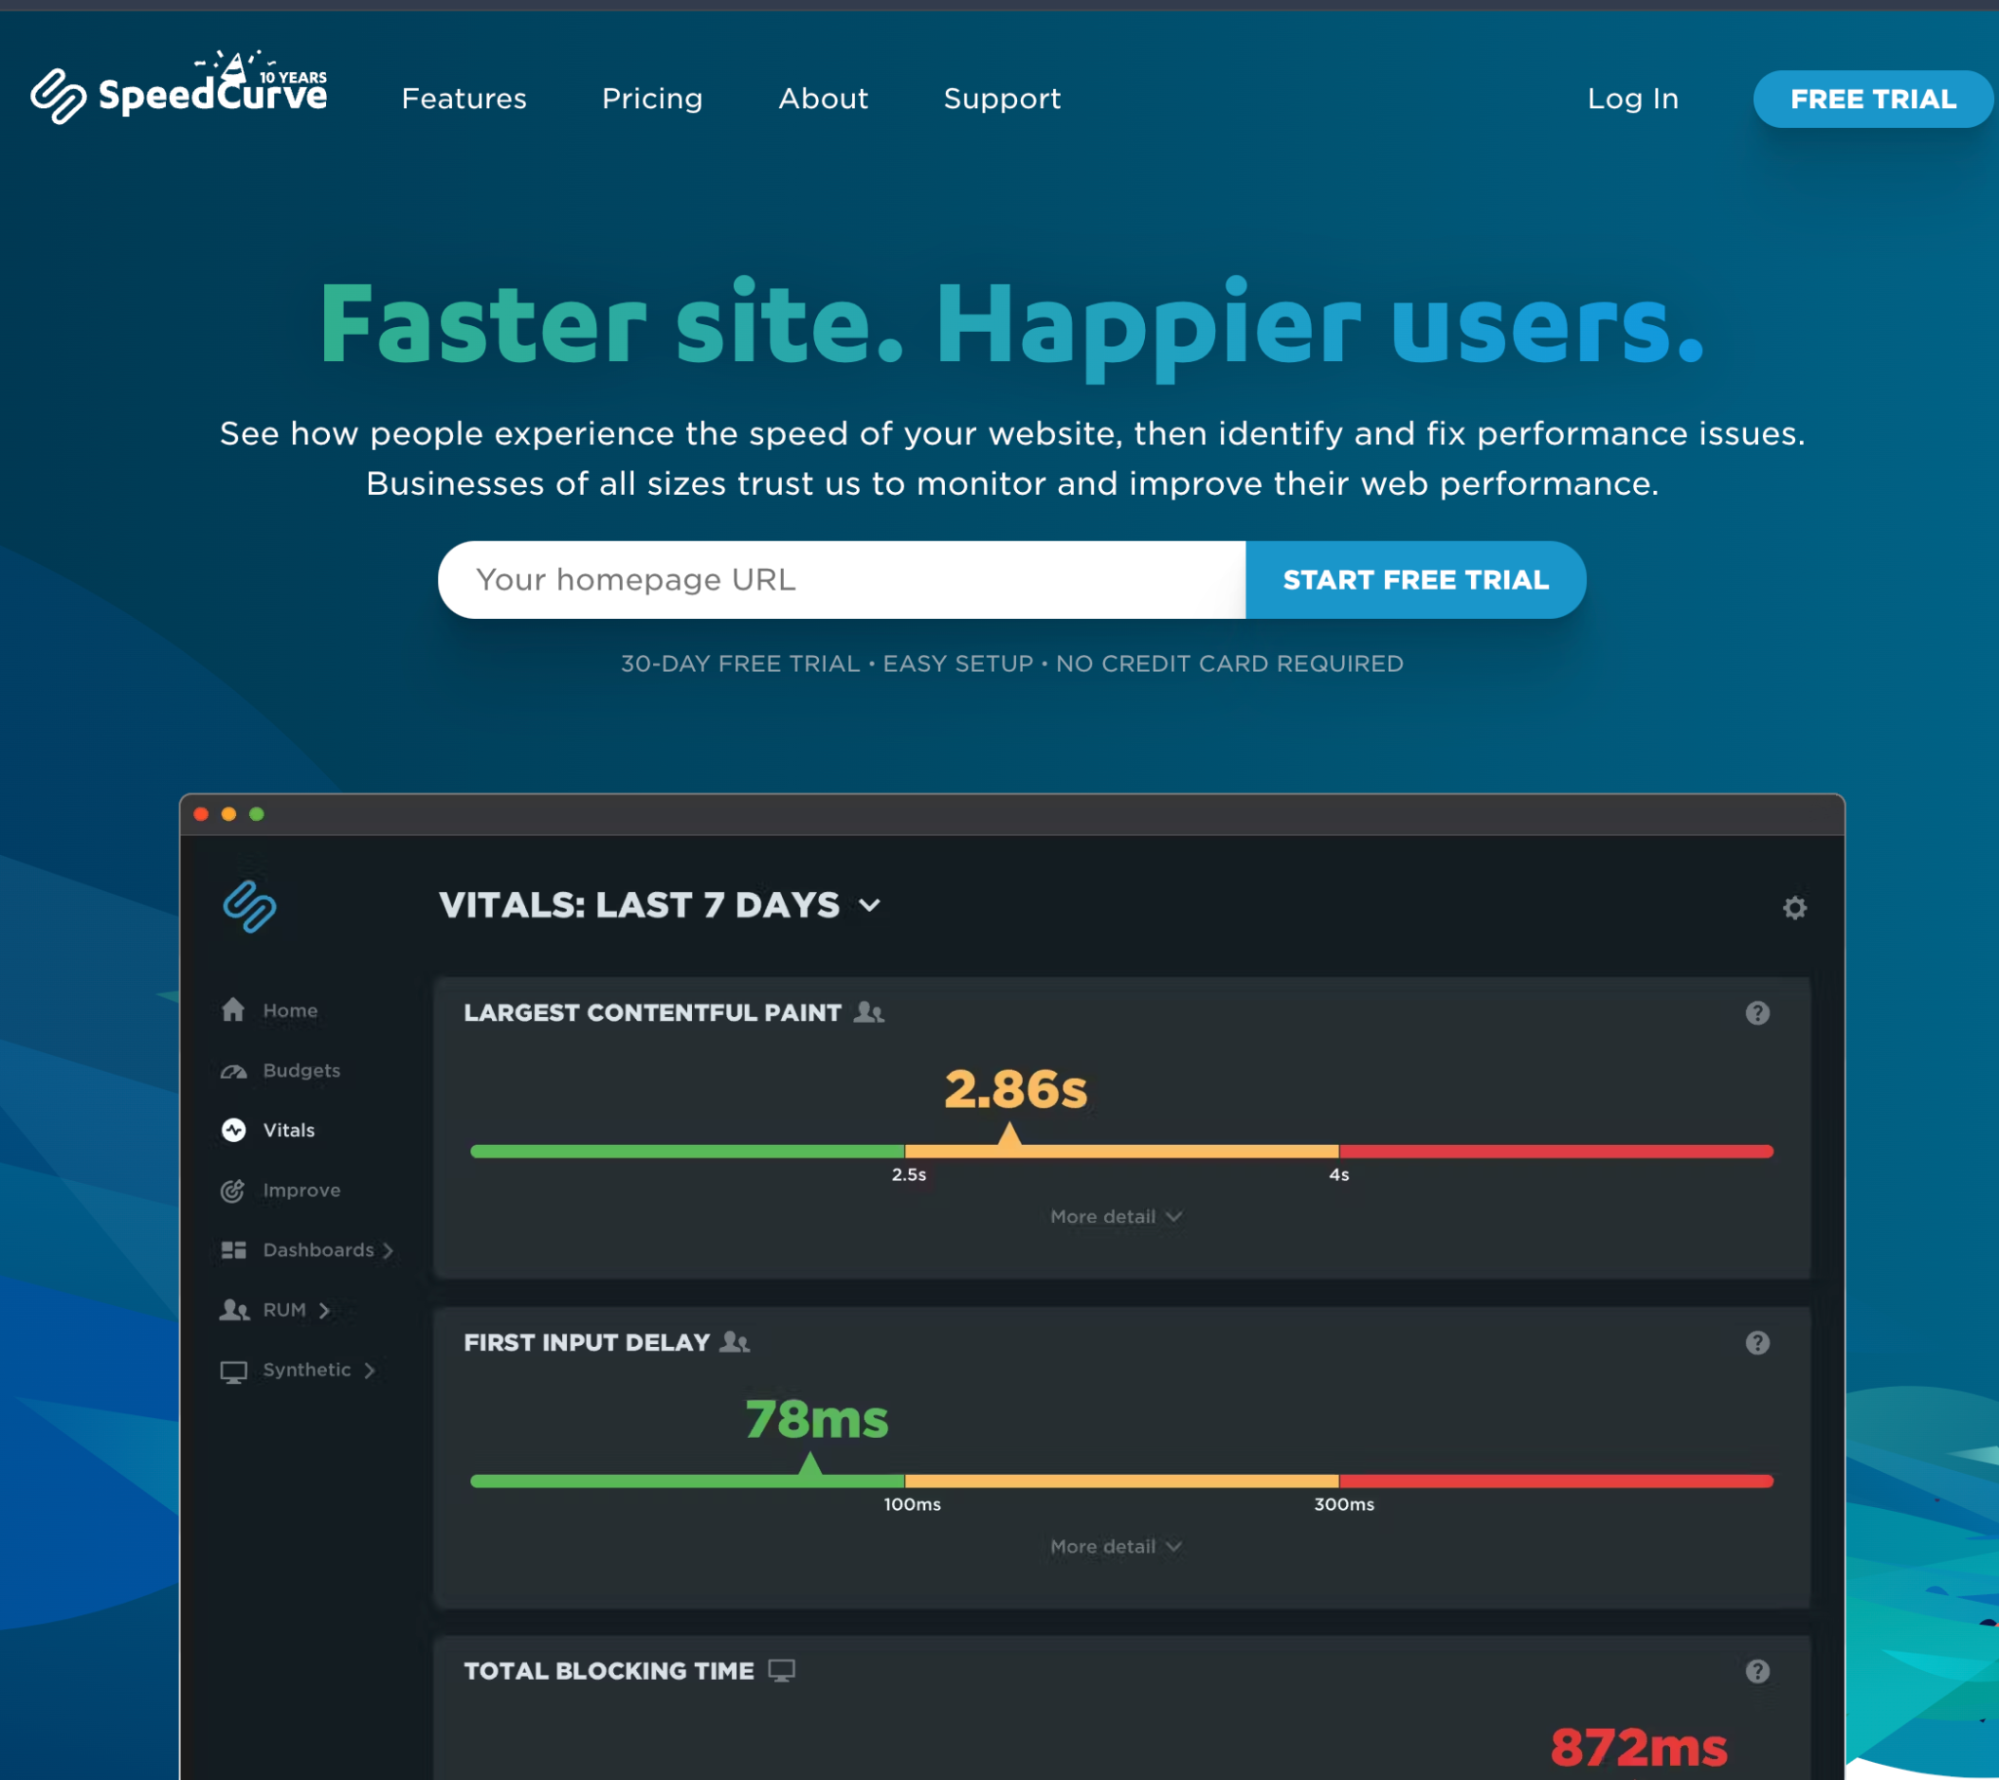
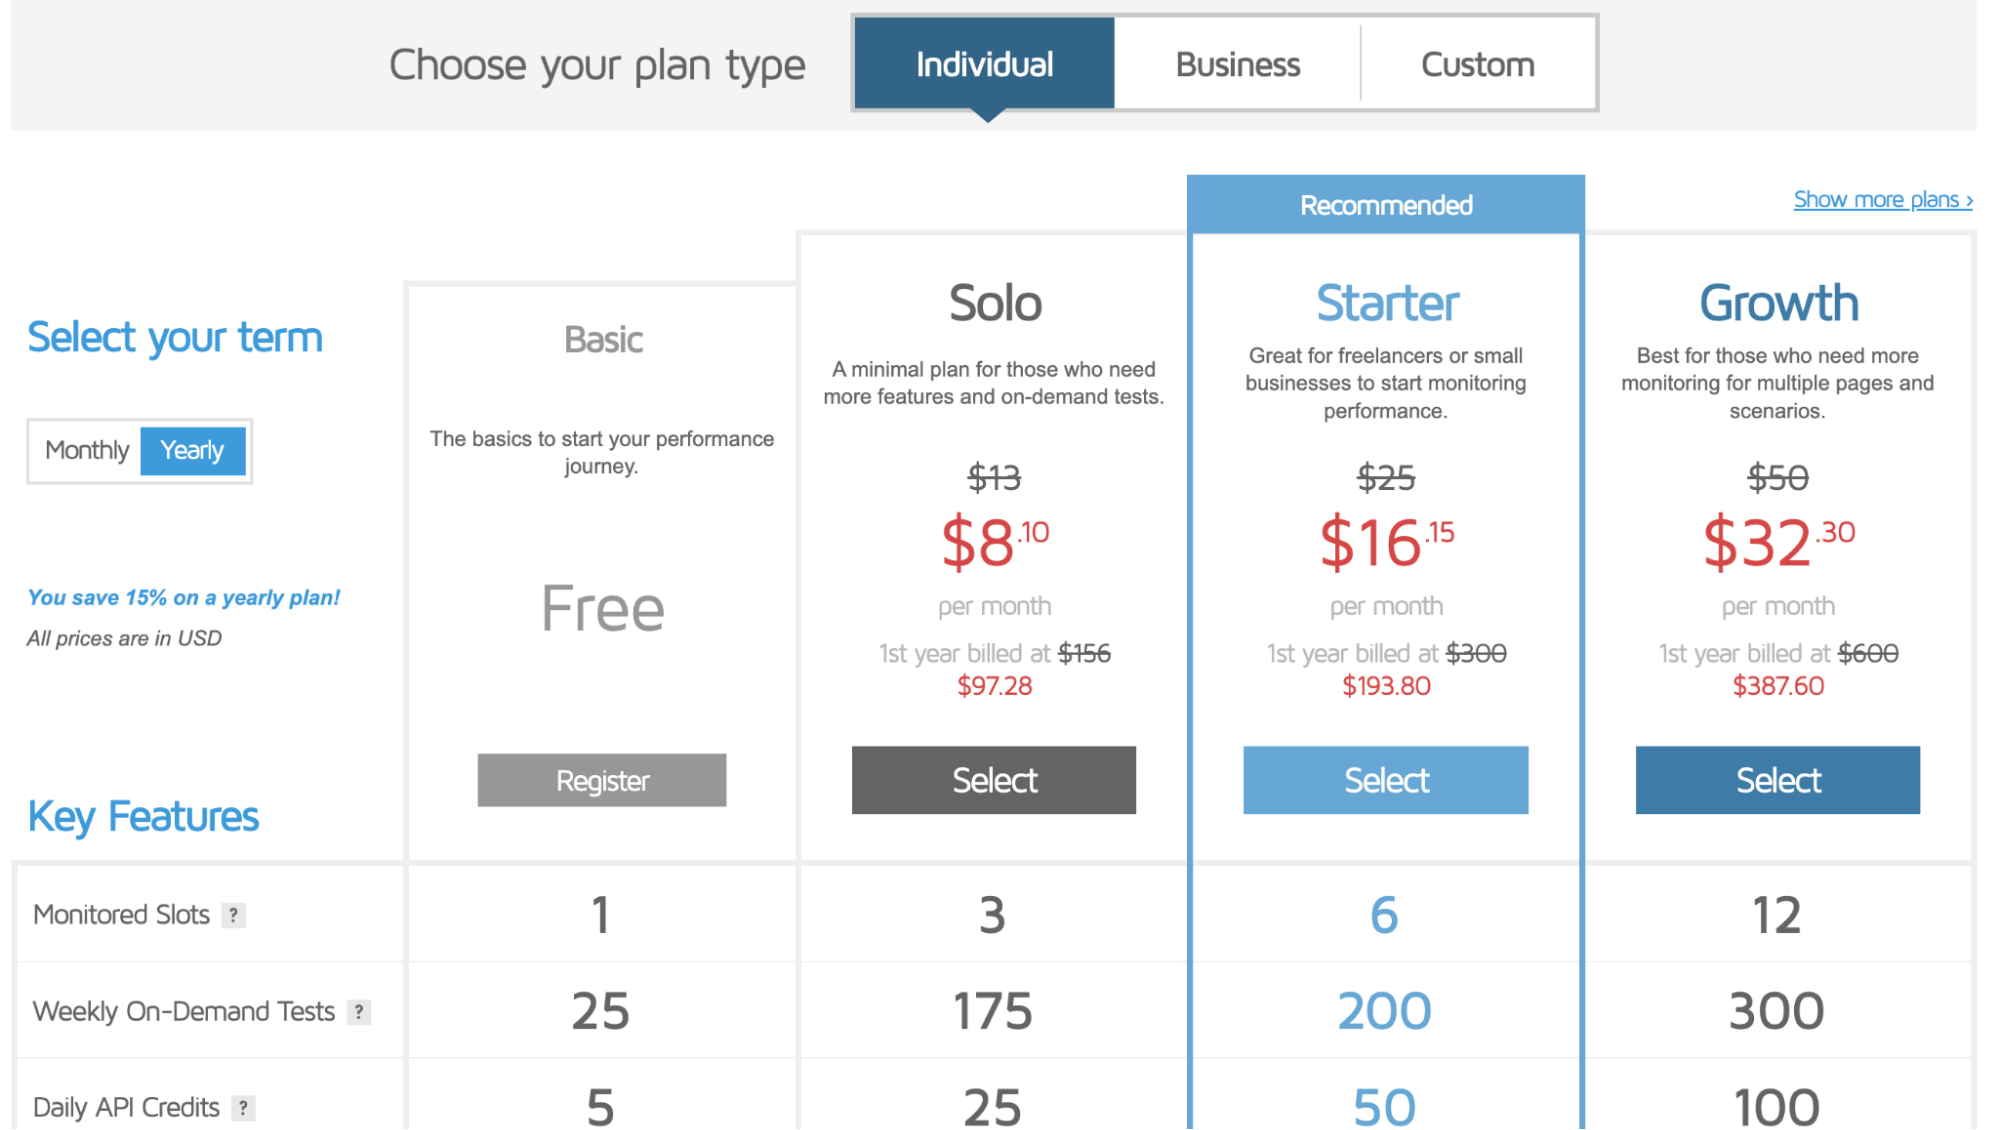
6- SpeedCurve
SpeedCurve provides continuous monitoring and performance budgeting with visualizations for easy interpretation of data.
Key Features: Continuous monitoring, visualizations, and performance budgeting.
Link for the product: https://www.speedcurve.com/
SpeedCurve
✅ Pros
- ✅ Continuous Monitoring: SpeedCurve provides continuous monitoring of website performance, allowing users to track changes over time and receive alerts for performance regressions.
- ✅ Performance Budgeting: Enables users to set performance budgets, helping teams ensure that web performance aligns with established goals and standards.
- ✅ Visualizations: Offers visualizations such as filmstrip views, speed curves, and waterfalls, making it easy to understand how pages load and identify areas for improvement.
- ✅ User-Centric Metrics: Measures user-centric metrics, including Largest Contentful Paint (LCP), Cumulative Layout Shift (CLS), and other Core Web Vitals.
- ✅ Third-Party Dependency Monitoring: Identifies and monitors third-party dependencies, providing insights into their impact on overall performance.
- ✅ Integration with Other Tools: Integrates with other tools and platforms, including alerting and collaboration tools, to streamline workflows.
❌ Cons
- ❌ Pricing for Larger Organizations: Pricing may be a concern for larger organizations with extensive monitoring needs.
- ❌ Learning Curve: For new users, there might be a learning curve to fully utilize all the features and customization options.
- ❌ Feature Set: While SpeedCurve offers a robust feature set, some users may find it lacks certain advanced features present in other tools.
💵 Pricing
SpeedCurve Pricing
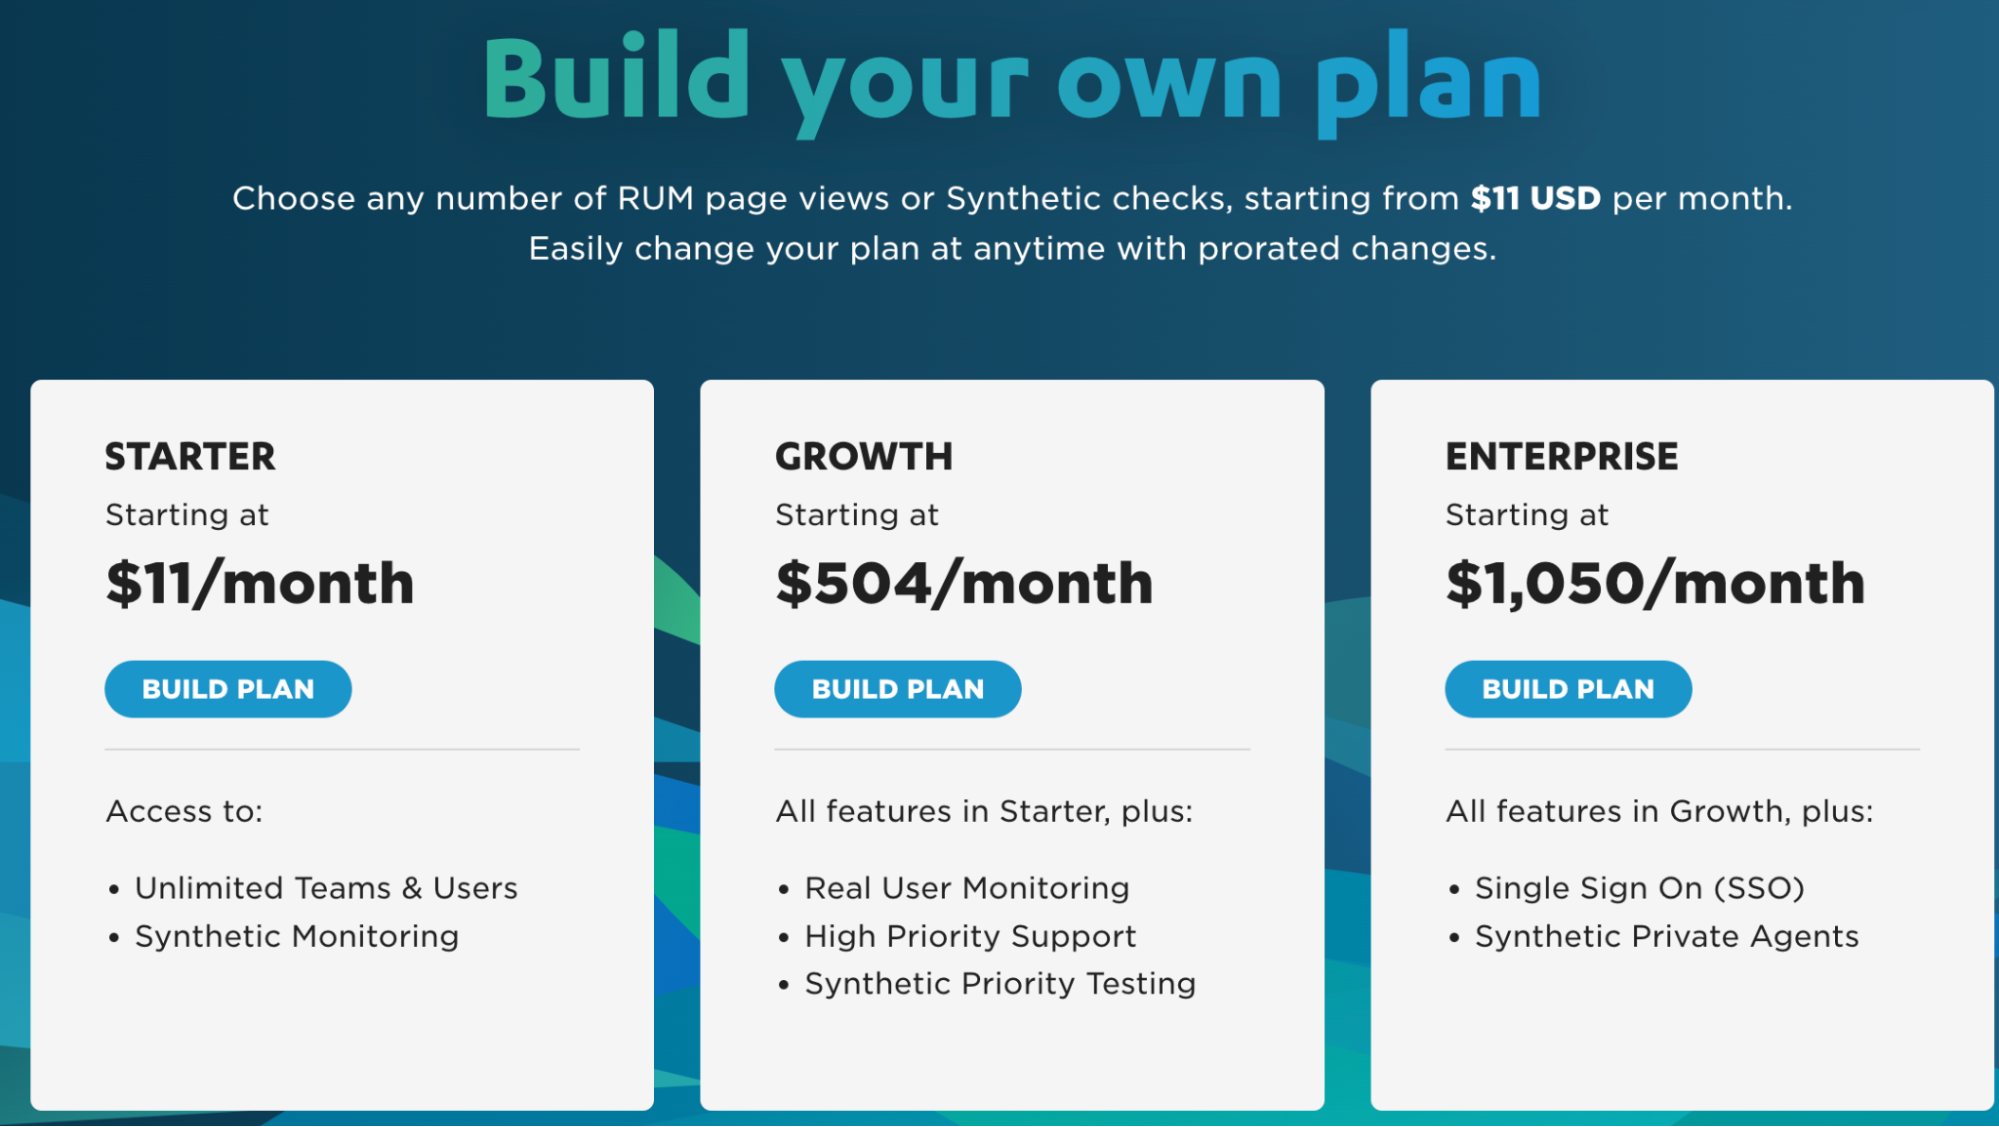
SpeedCurve typically offers a subscription-based pricing model with different tiers, catering to various levels of monitoring needs. Pricing details may include factors such as the number of monitored sites, frequency of testing, and additional features.
- Free Trial: SpeedCurve often provides a free trial period for users to test the service.
- Paid Plans: Paid plans vary based on the level of monitoring required, and pricing can range from a basic tier to higher amounts for larger plans with more features.
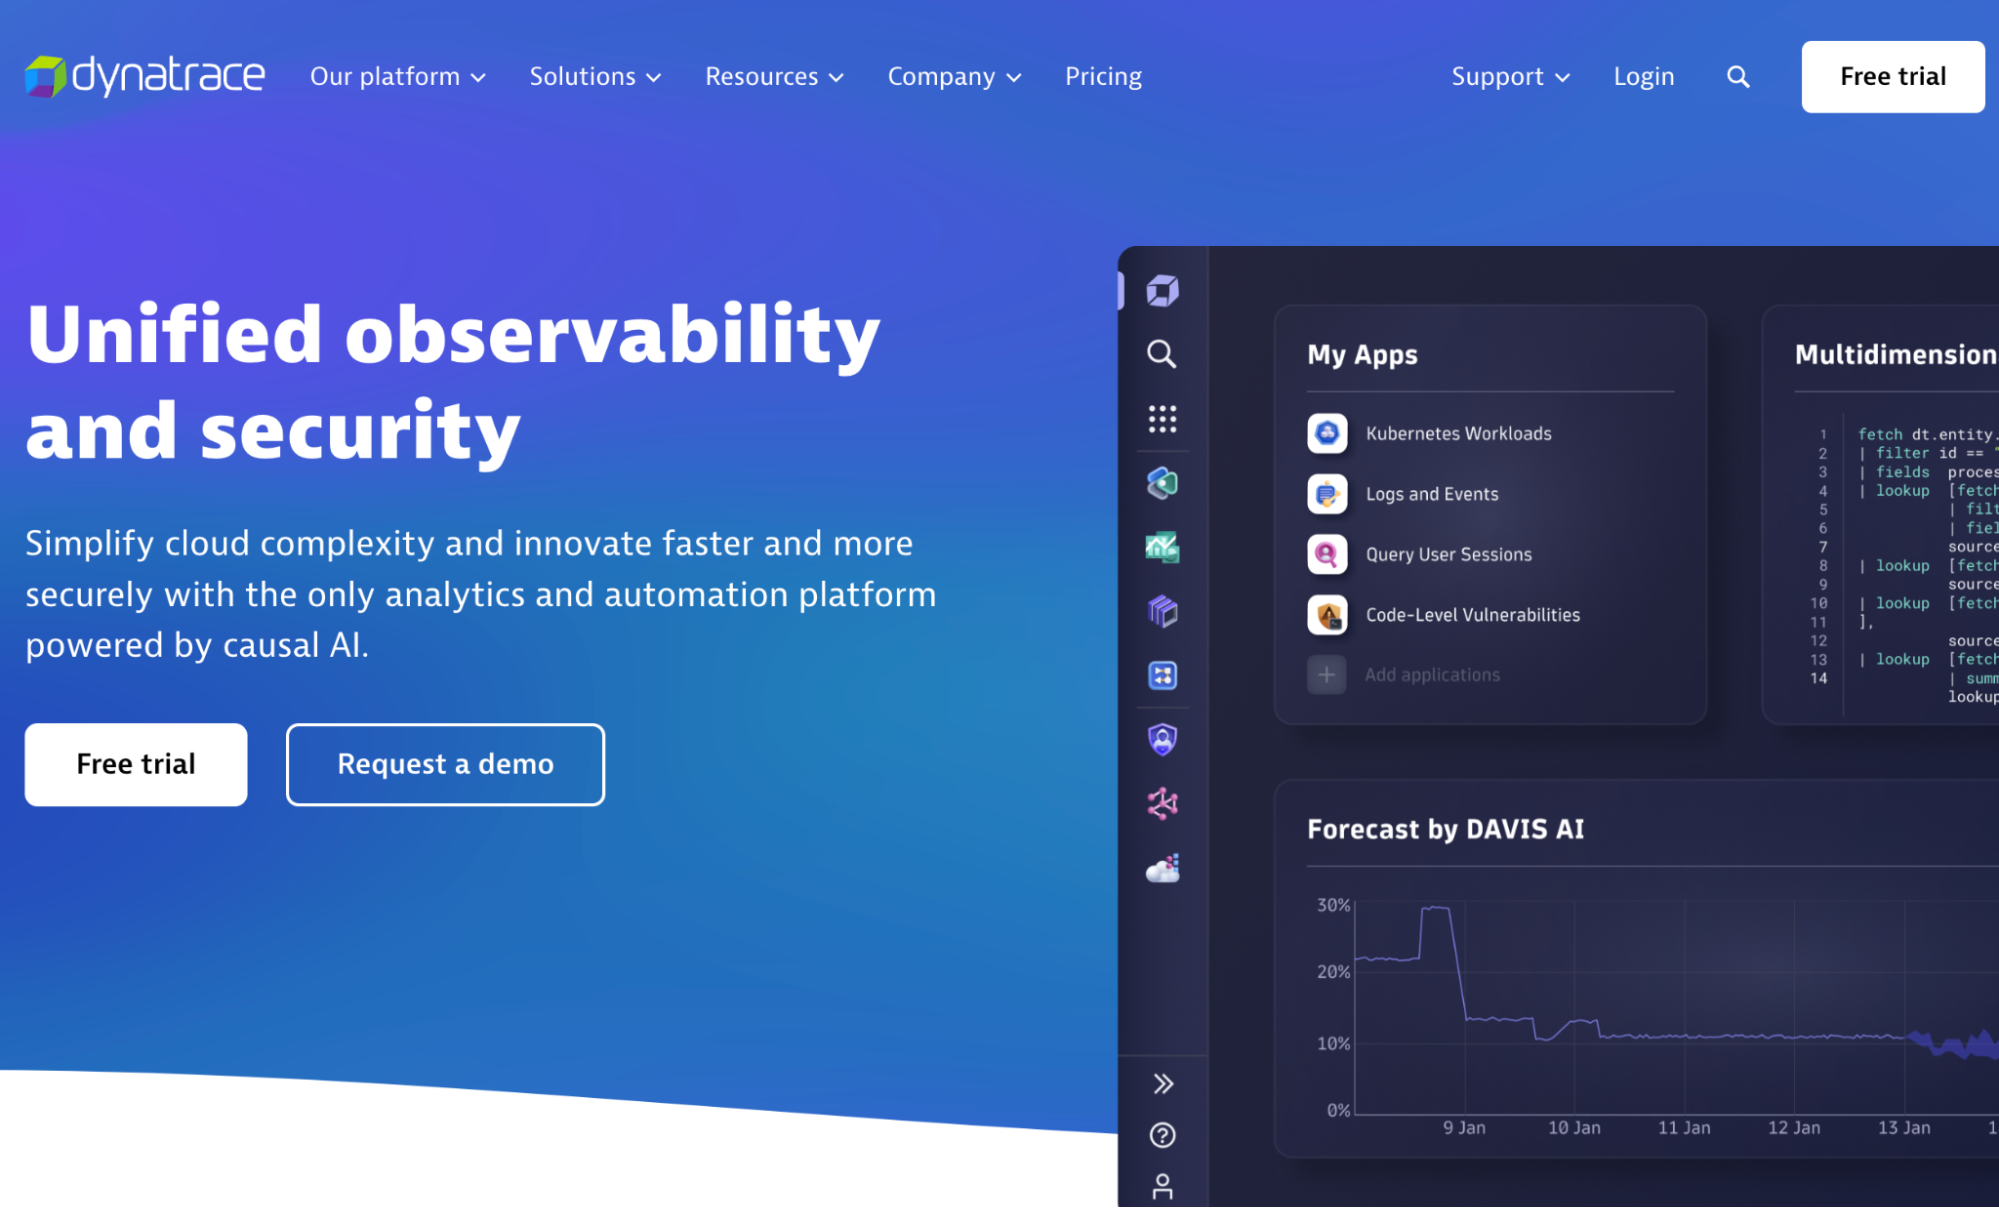
7- Dynatrace
Dynatrace is an AI-driven monitoring tool providing end-to-end visibility into the entire application stack, with automatic problem detection and analysis.
Key Features: AI-driven insights, end-to-end visibility, and deep dive diagnostics.
Link for the product: https://www.dynatrace.com
Dynatrace
✅ Pros
- ✅ AI-Driven Insights: Dynatrace utilizes artificial intelligence for automatic problem detection and root cause analysis, providing proactive insights into performance issues.
- ✅ End-to-End Visibility: Offers end-to-end visibility into the entire application stack, including frontend, backend, and third-party services.
- ✅ Real User Monitoring (RUM): Provides real user monitoring to understand and analyze the actual user experience, including user behavior and engagement.
- ✅ Session Replay: Allows session replay, enabling teams to visualize and understand user interactions with the application. Application Topology Mapping: Offers dynamic application topology mapping, helping teams understand the dependencies and relationships between different components.
- ✅ Deep Dive Diagnostics: Enables deep dive diagnostics for detailed analysis of performance bottlenecks and issues.
❌ Cons
- ❌ Pricing for Larger Organizations: Dynatrace's pricing structure may be a concern for larger organizations with extensive monitoring needs.
- ❌ Learning Curve: Due to its extensive feature set, there may be a learning curve for new users.
💵 Pricing
Dynatrace Pricing
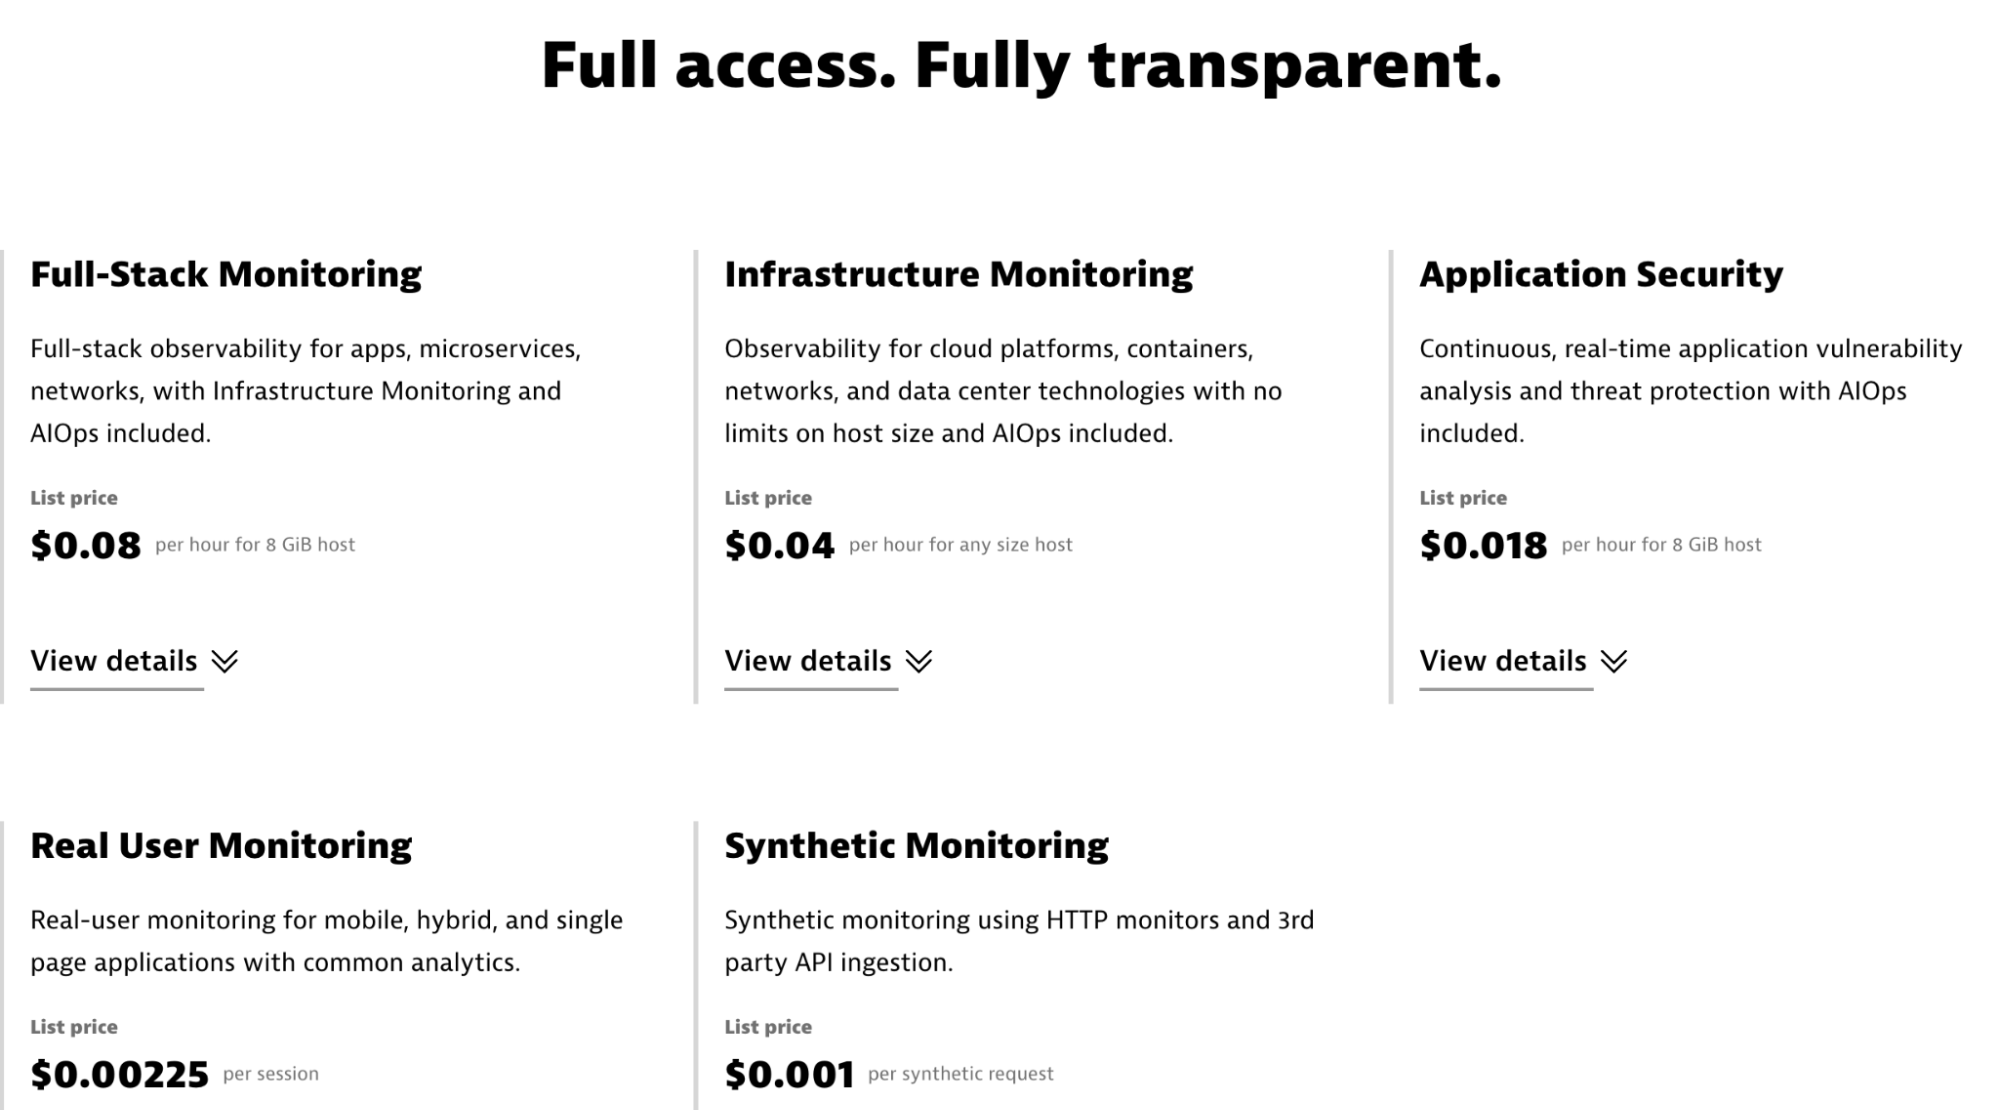
Dynatrace typically offers a subscription-based pricing model, and pricing details may include factors such as the number of monitored hosts, services, and additional features.
- Free Trial: Dynatrace often provides a free trial period for users to explore and test the service.
- Paid Plans: Paid plans are available with different tiers, catering to various levels of monitoring needs. Pricing can range from a basic tier to higher amounts for larger plans with more features.
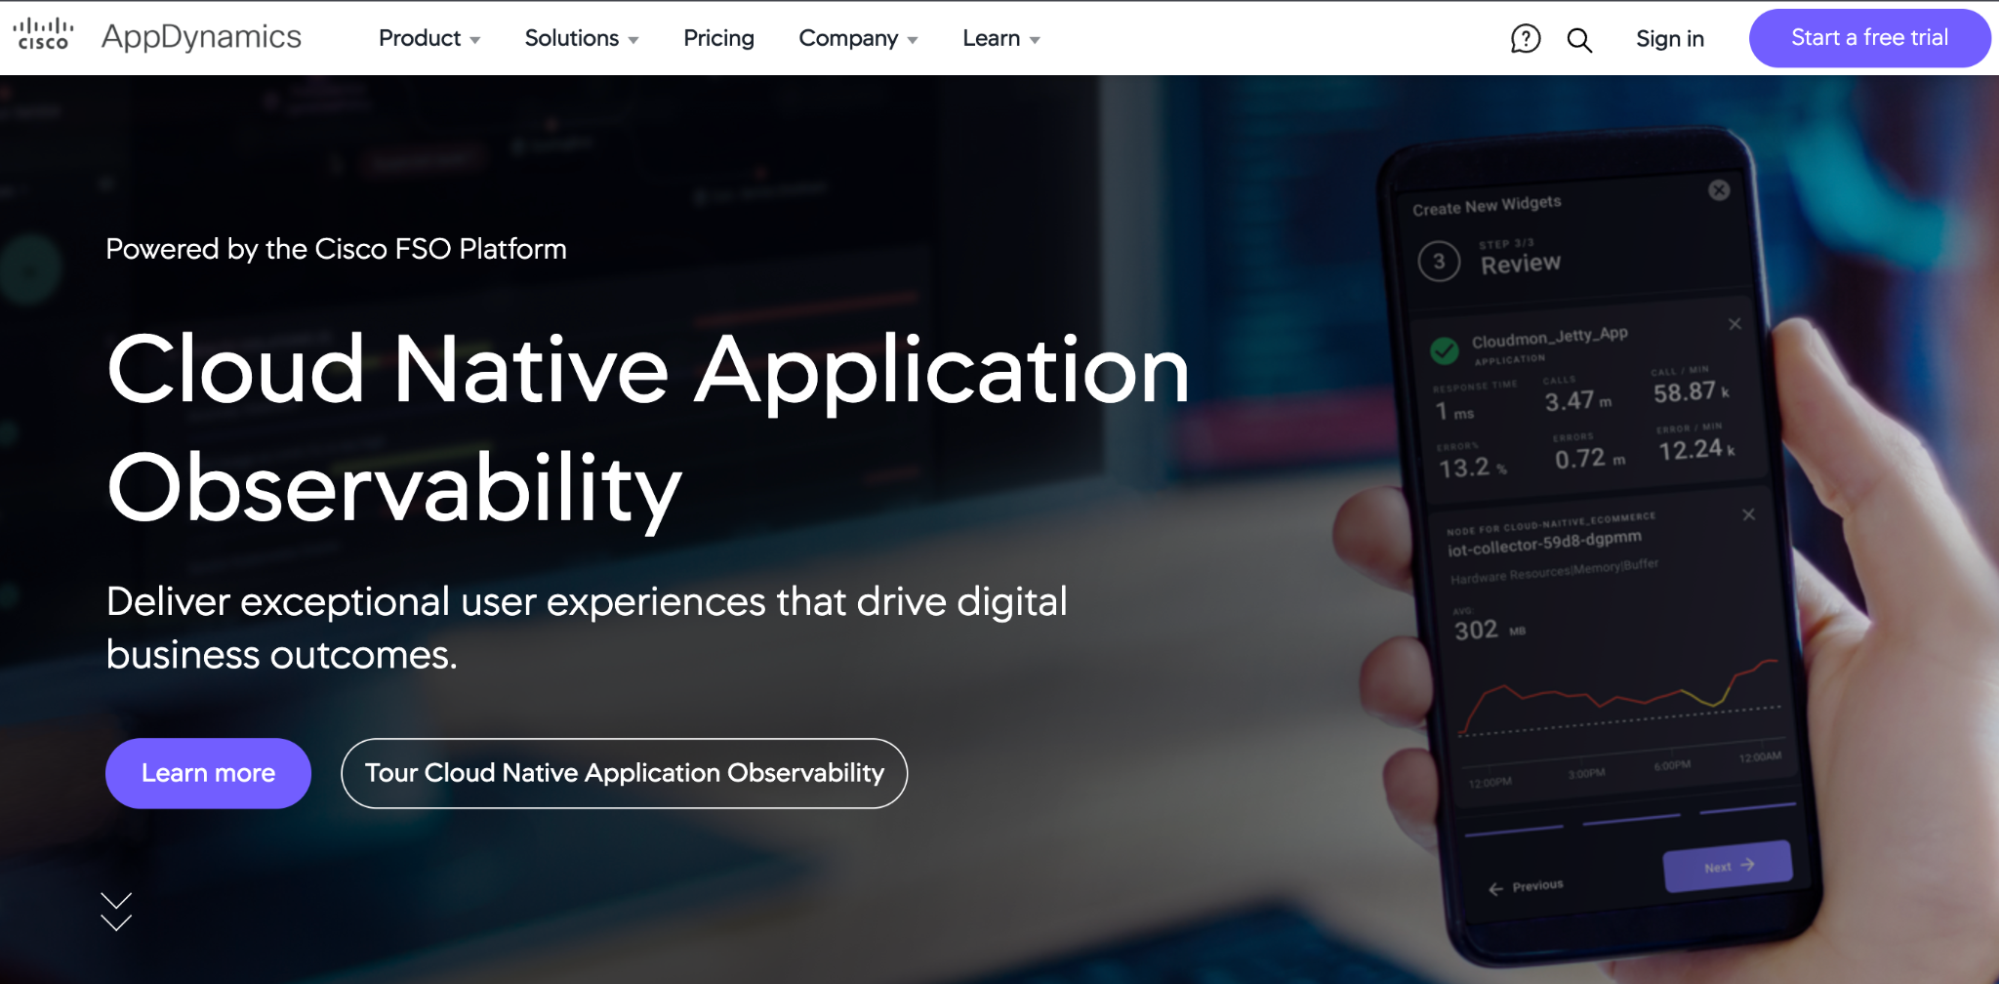
8- AppDynamics
AppDynamics offers real-time monitoring and diagnostics for frontend and backend performance, with business transaction monitoring and deep dive diagnostics.
Key Features: Real-time monitoring, end-to-end visibility, and business transaction
Link for the product: https://www.appdynamics.com/
AppDynamics
✅ Pros
- ✅ Real-Time Monitoring: AppDynamics offers real-time monitoring of frontend and backend performance, providing insights into user experiences, transactions, and system behavior.
- ✅ End-to-End Visibility: Provides end-to-end visibility into the entire application stack, enabling teams to correlate frontend performance with backend services.
- ✅ Deep Dive Diagnostics: AppDynamics offers deep dive diagnostics, allowing users to identify and troubleshoot performance bottlenecks and issues.
- ✅ Transaction Tracing: Enables transaction tracing for detailed analysis of user interactions and their impact on performance.
- **✅ Business Transaction Monitoring: Allows monitoring of critical business transactions, helping prioritize and optimize based on business impact.
- ✅ User Session Tracking: Provides user session tracking for understanding user behavior and interactions with the application.
❌ Cons
- ❌ Pricing for Larger Organizations: AppDynamics' pricing structure may be a concern for larger organizations with extensive monitoring needs.
- ❌ Learning Curve: Due to its extensive feature set, there may be a learning curve for new users.
💵 Pricing
AppDynamics Pricing
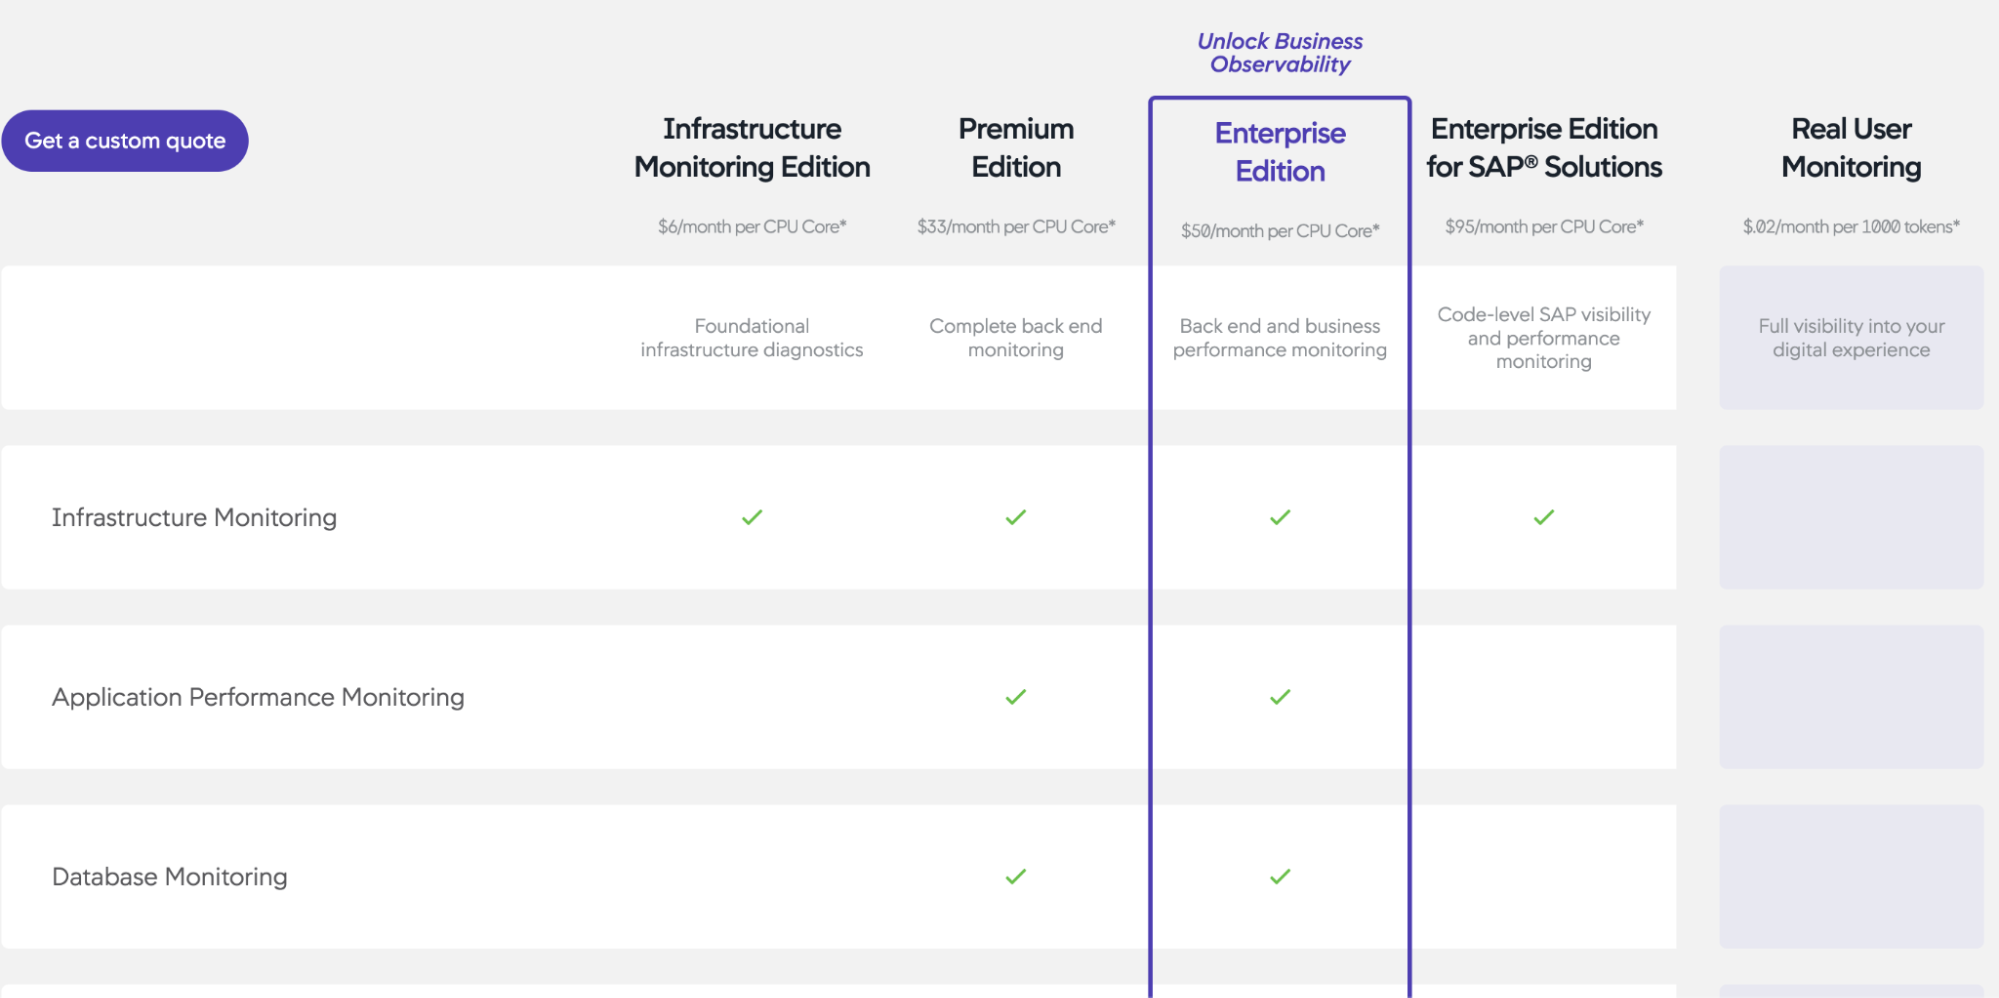
AppDynamics typically offers a subscription-based pricing model, and pricing details may include factors such as the number of monitored hosts, services, and additional features.
- Free Trial: AppDynamics often provides a free trial period for users to explore and test the service.
- Paid Plans: Paid plans are available with different tiers, catering to various levels of monitoring needs. Pricing can range from a basic tier to higher amounts for larger plans with more features.
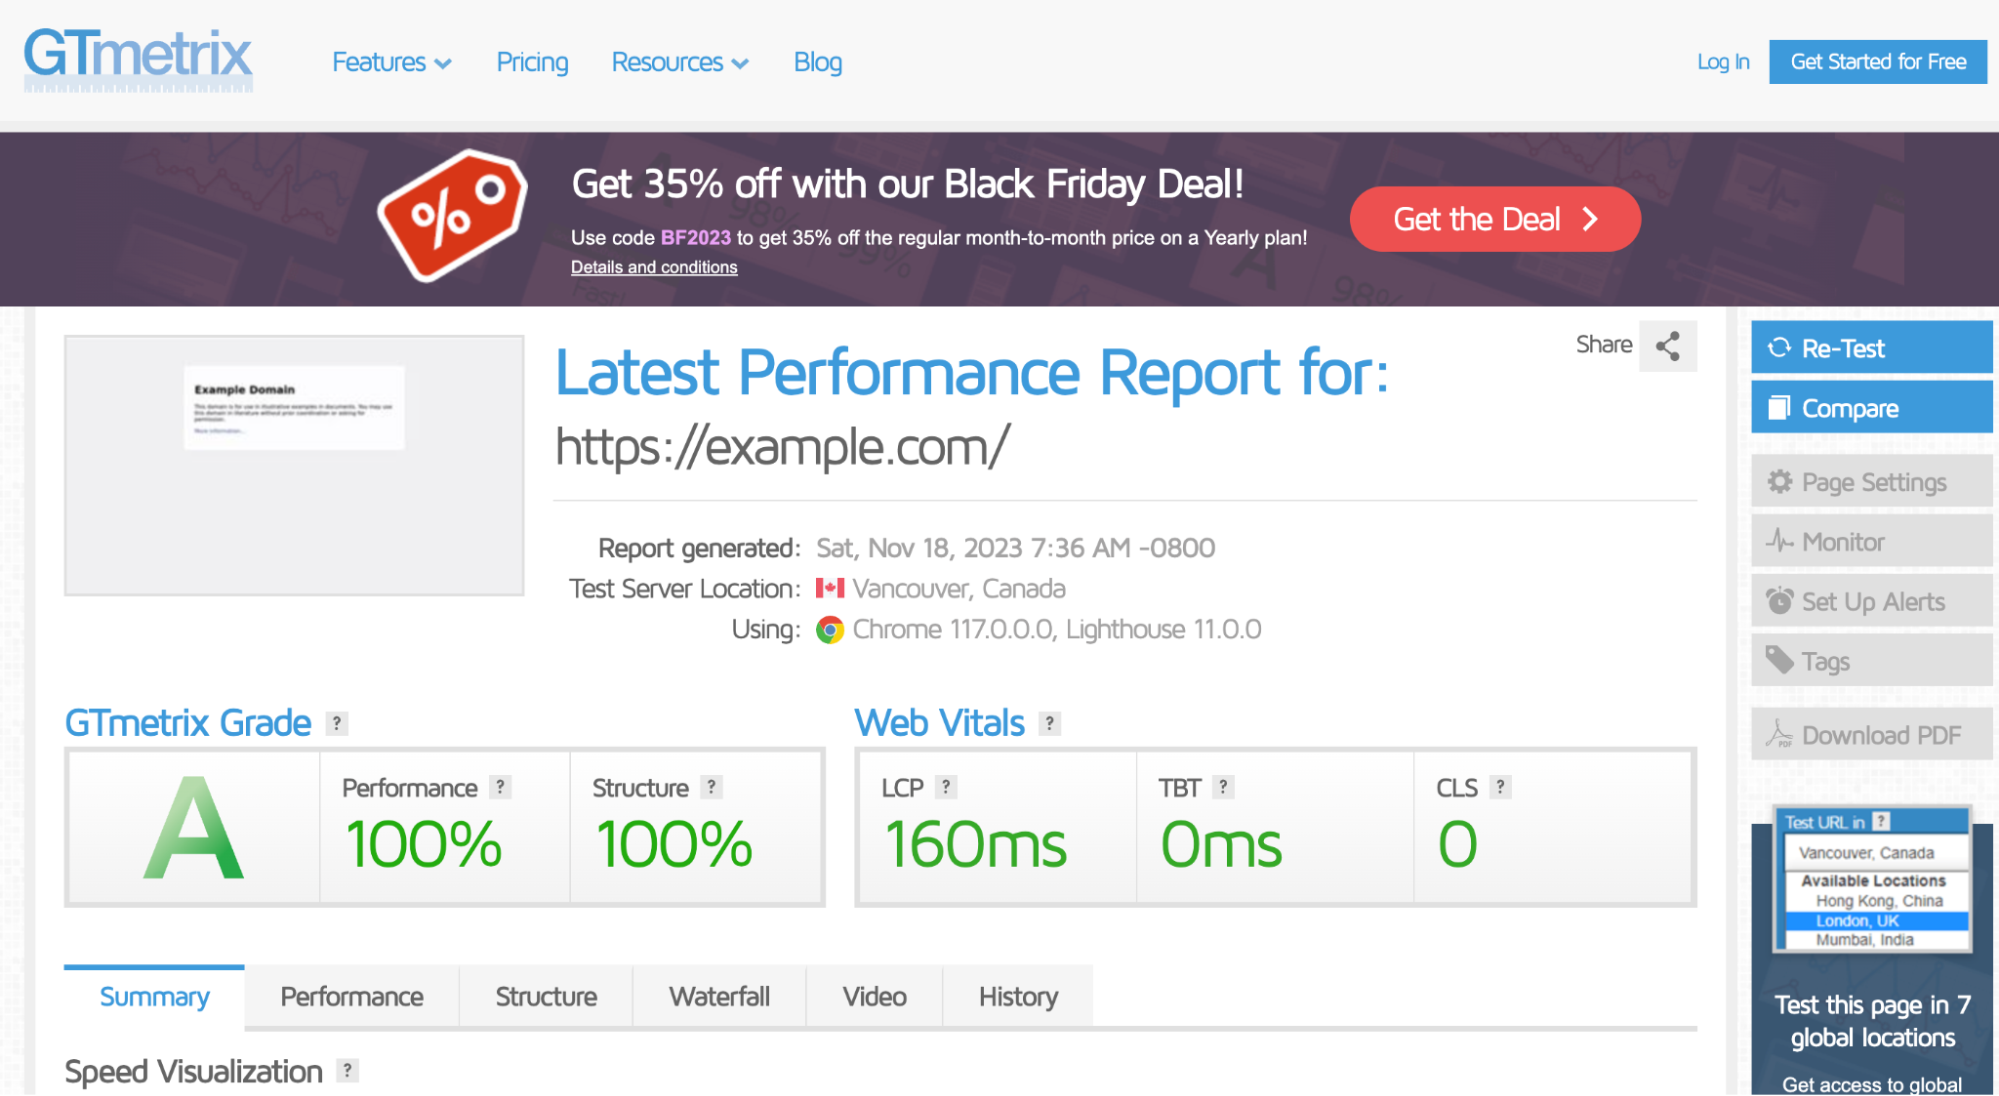
9- GTmetrix
GTmetrix focuses on page speed insights, offering actionable recommendations for optimizing website performance.
Key Features: Page speed insights, testing from different locations, and historical data.
Link for the product: https://gtmetrix.com/
GTmetrix
✅ Pros
- ✅ Page Speed Insights: GTmetrix provides detailed insights into various page speed metrics, including load time, page size, and the number of requests.
- ✅ Actionable Recommendations: Offers actionable recommendations for optimizing website performance, such as image optimization, script execution, and caching improvements.
- ✅ Testing from Different Locations: Allows testing website performance from different locations around the world, helping identify regional performance variations.
- ✅ Historical Data: Provides historical data and trends, allowing users to track changes in performance over time.
- ✅ Waterfall Charts and Filmstrip Views: Visualizes page loading with waterfall charts and filmstrip views, helping identify bottlenecks and resource loading sequences.
- ✅ Customizable Testing Options: GTmetrix offers customizable testing options, allowing users to test different devices, connection speeds, and more.
❌ Cons
- ❌ Free Version Limitations: The free version of GTmetrix may have limitations in terms of the number of tests and features available.
- ❌ May Lack Real User Monitoring: GTmetrix primarily focuses on synthetic monitoring and may not provide real user monitoring features.
💵 Pricing
GTmetrix Pricing
GTmetrix offers both free and paid plans.
- Free Plan: The free plan includes basic features with limitations on the number of tests and some advanced features.
- Paid Plans: GTmetrix offers various paid plans with additional features such as more tests per day, historical data storage, and priority access to new features. Pricing can range from a few dollars per month to higher amounts for larger plans.
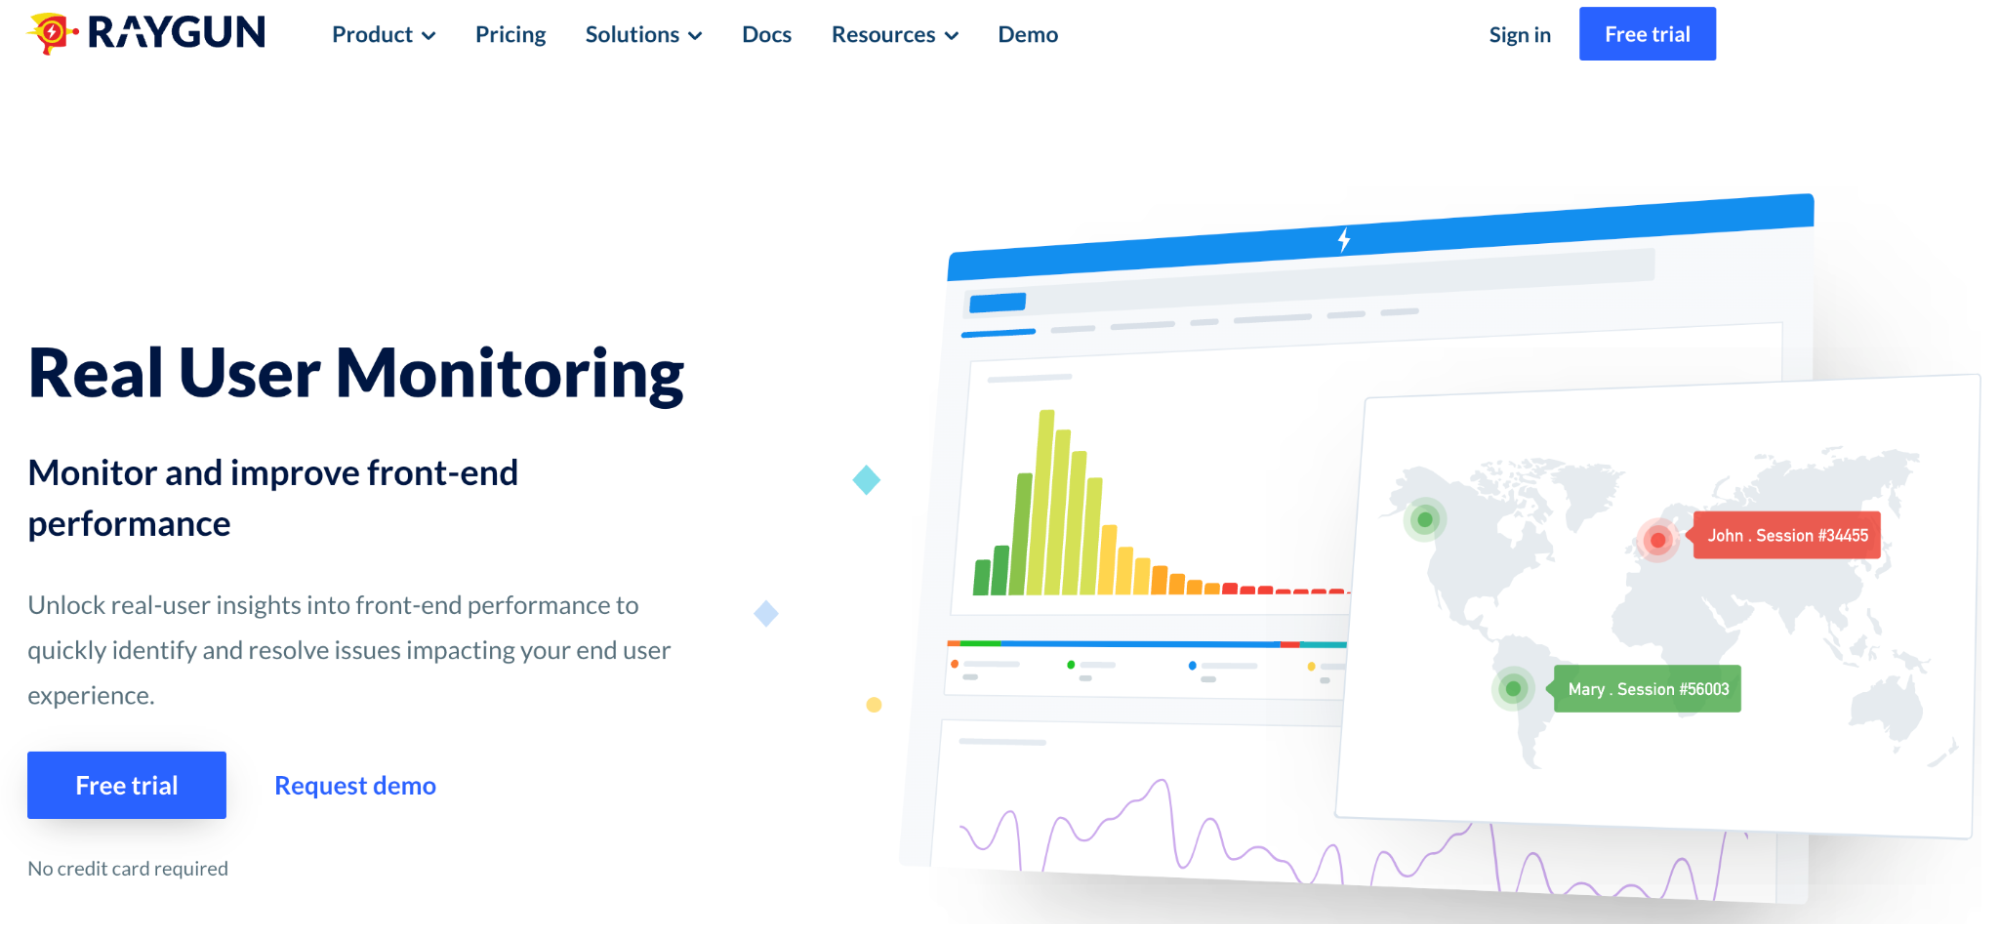
10- Raygun Real User Monitoring
Raygun Real User Monitoring is a tool designed to provide in-depth insights into how users interact with your web applications. As of my last update, Raygun RUM offers features such as: real user monitoring, session replay, performance metrics.
Key features: Real user monitoring, Session replay, Performance metrics
Link for the product: https://raygun.com/platform/real-user-monitoring
Raygun
✅ Pros
- ✅ Real User Monitoring (RUM): Raygun specializes in real user monitoring, providing insights into actual user experiences, including page load times, interactions, and errors.
- ✅ Session Replay: Offers session replay functionality, allowing developers to visualize user sessions and understand how users interact with the application.
- ✅ Error Tracking Integration: Seamless integration with Raygun's error tracking features, providing a comprehensive view of both frontend performance and errors.
- ✅ User-Centric Insights: Focuses on understanding user behavior and optimizing performance based on real-world user interactions.
- ✅ Performance Metrics: Provides detailed performance metrics, including load times, page views, and user engagement, helping identify areas for improvement.
- ✅ Data Visualization: Utilizes visualizations to present performance data, making it easier for developers to interpret and act upon the insights.
❌ Cons
- ❌ Pricing: Pricing details may be a consideration for smaller teams or organizations with budget constraints. It's essential to review the pricing model and choose a plan that aligns with specific monitoring needs.
- ❌ Feature Set: While Raygun excels in real user monitoring and error tracking, some users might find that certain advanced features present in other tools are not available.
- ❌ Learning Curve: Like any monitoring tool, there may be a learning curve for new users, especially those who are new to real user monitoring concepts.
💵 Pricing
Raygun Pricing
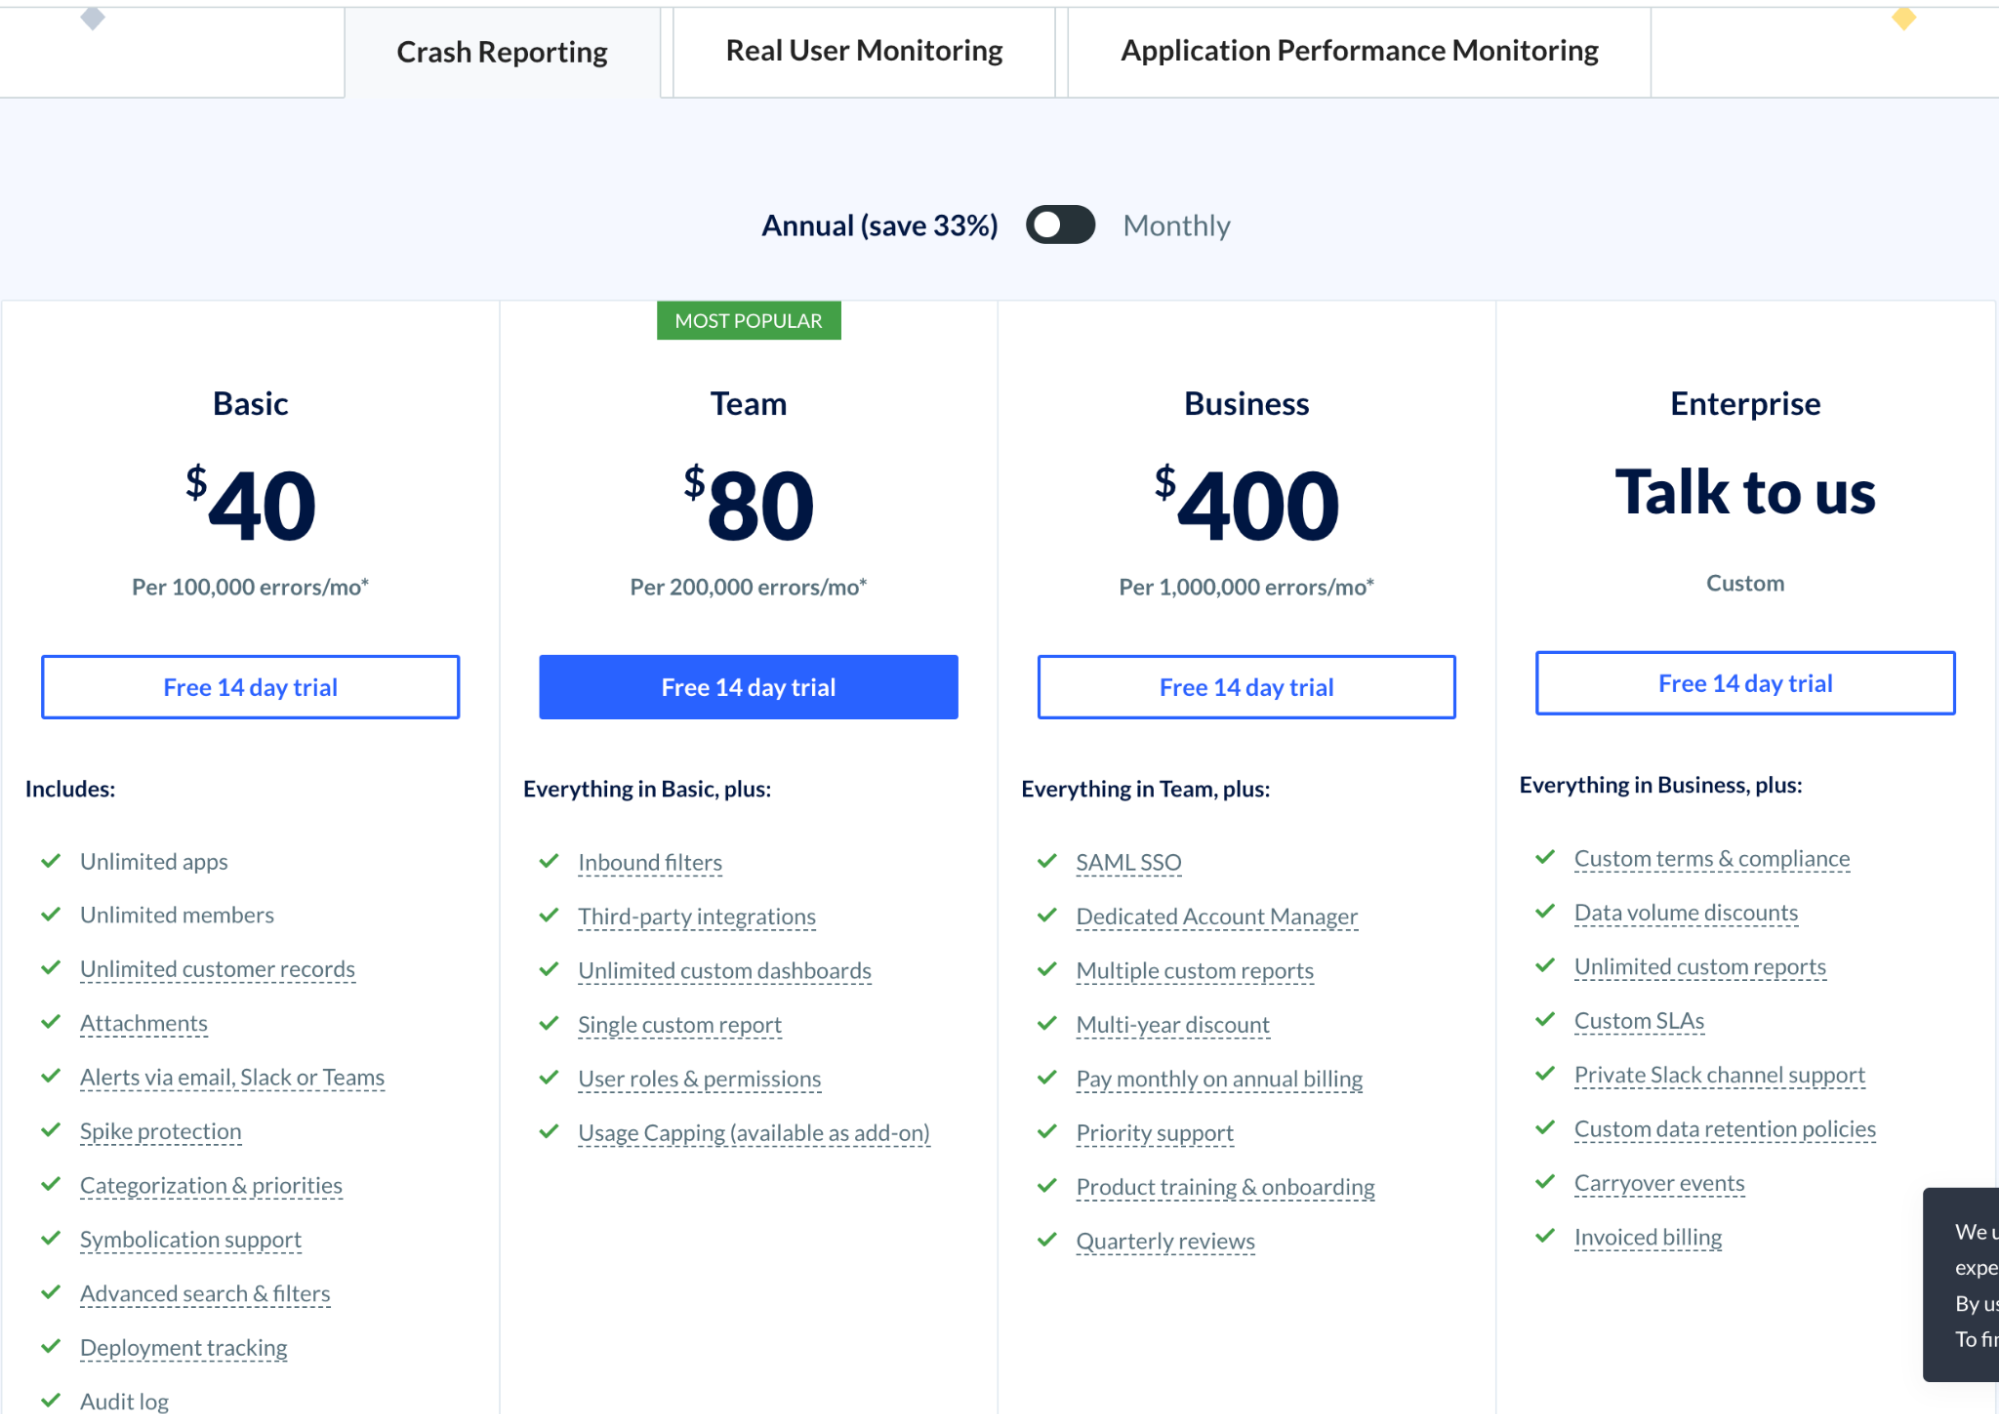
Raygun typically offers a subscription-based pricing model with different plans tailored to various needs. Pricing factors may include the volume of user sessions, features required, and the level of support.
- Free Trial: Raygun often provides a free trial period for users to explore and test the service.
- Paid Plans: Paid plans are available with different tiers, catering to various levels of monitoring needs. Pricing can range from a basic tier to higher amounts for larger plans with more features.
Conclusion
In conclusion, the tools discussed provide valuable resources for monitoring and improving frontend performance in 2023. Each tool offers unique features, from real-time insights to detailed analytics, catering to different needs in website optimization. Whether for small businesses or large enterprises, these tools can enhance user experience and streamline web performance management. Choosing the right tool depends on specific requirements and goals, ensuring efficient and effective frontend performance monitoring.
Please note that details, features, and pricing might have changed, so it's crucial to check the official product websites for the latest information. Here are the details based on our research on 17.11.2023.
Share on social media: